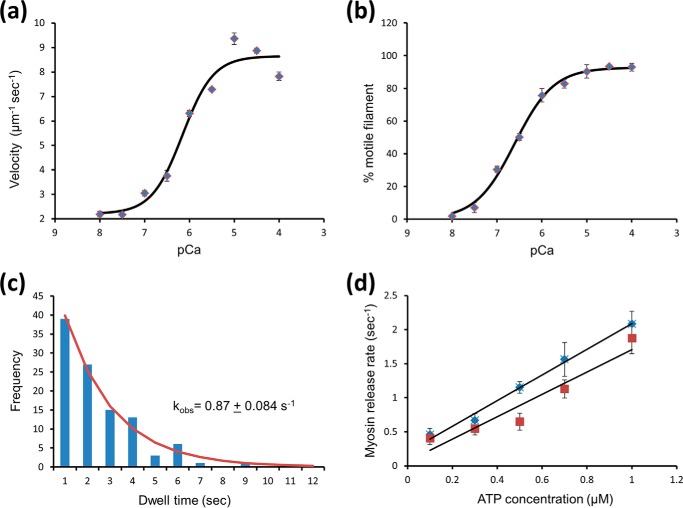
FIGURE 2.
Confirmation of thin filament regulation. a, in vitro motility sliding velocities of the regulated thin filament were determined using in vitro motility, where the thin filament gliding speed over a surface coated with myosin (50 μg/ml) was measured at different calcium concentrations. These data were fitted to a Hill cooperative binding equation providing a Hill coefficient of 1.26 ± 0.46, pCa50 of 6.15 ± 0.14, offset velocity 2.2 ± 0.5 μm s−1, and maximal sliding velocity 8.65 ± 0.88 μm s−1. b, percentage of motile filaments versus pCa show a similar increase with calcium with a pCa50 of 6.6 ± 0.04. A motile filament was defined (12) as having a mean velocity >0.33 μm s−1. c, lifetime of attachments from multiple molecules of myosin at 0.8 nm and 0.5 μm ATP with naked actin can be plotted as a histogram. Each lifetime histogram is fitted to an exponential decay providing the detachment rate constant for the solution condition. d, plot of the detachment rate constant versus ATP concentration shows a linear relationship. The slope of this plot provides the second order ATP-binding rate constant for naked actin (diamonds) of 1.88 μm−1 s−1 and for thin filaments at pCa 4 (squares) of 1.64 μm−1s−1. These values agree well with ensemble studies (39–41).

