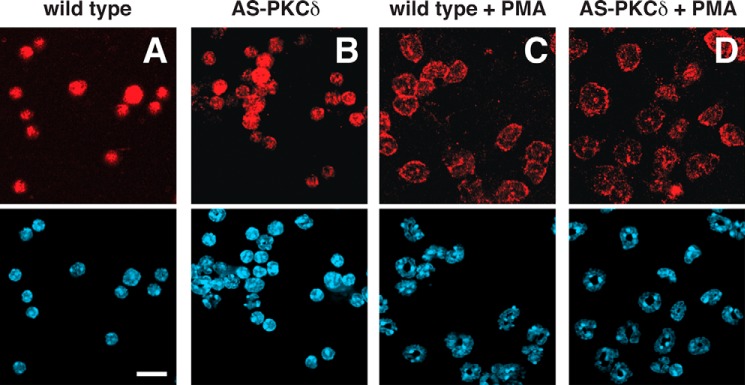
FIGURE 5.

Pattern of PKCδ immunoreactivity in neutrophils of WT PKCδ (A and C) and AS PKCδ (B and D) mice. PKCδ (red) was detected diffusely in the cytoplasm at baseline (A and B) and at the plasma membrane after incubation with 200 nm PMA for 2 min (C and D). Nuclei (blue) were detected with DAPI in the bottom panels. Scale bar, 25 μm.
