
FIGURE 5.
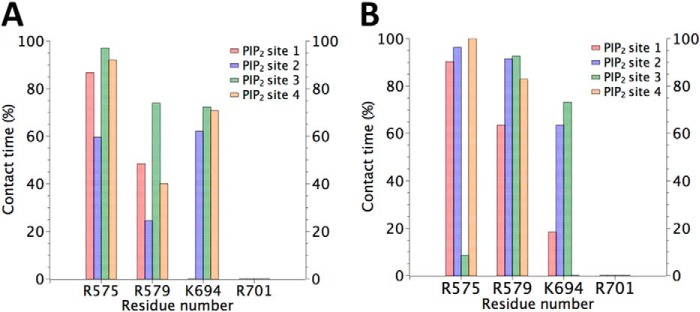
Statistical analysis of the residues in contact with the phosphates groups of PI(4,5)P2. The contact time is represented as the percentage of the time of the full molecular dynamics simulation in which the amino acid residue indicated in the abscissa interacts with the phosphate groups of PI(4,5)P2. A distance between the amino acid residue and PI(4,5)P2 less than 3 Å is considered as a contact. Four PI(4,5)P2 molecules were located in the four identical binding pockets designed Site 1, 2, 3, and 4. Panel A shows the data from simulation APO-TRPV1+ PI(4,5)P2 and B is the result from RTX-DkTx TRPV1 PI(4,5)P2+CAP trajectory. The negatively charged headgroup of PI(4,5)P2 shows a high frequency of interaction with the residues Arg-575, Arg-579, and Lys-694. Residue Arg-701 has negligible contact with PI(4,5)P2.