
FIGURE 2.
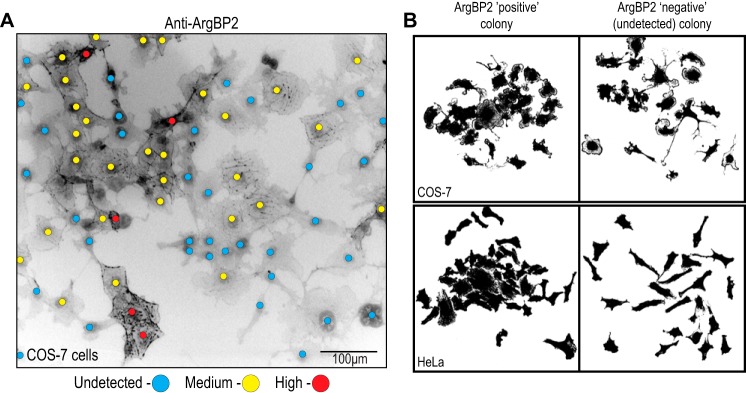
Clonal analysis of ArgBP2 expression in COS-7 and HeLa cells. A, COS-7 cells demonstrate a mosaic expression for ArgBP2 as assessed by indirect immunofluorescence. Red and yellow dots denote ArgBP2 high and medium/low expression, respectively, and blue dots denote cells with undetectable ArgBP2 levels. The fluorescent signal is inverted (white to black) for greater clarity. B, HeLa and COS-7 colonies derived from single cells in culture were fixed and analyzed at day 6. The cell outlines (using binary mask of anti-α-actinin staining) illustrates the typical cell morphology of these clonal populations, with either detectable (ArgBP2 positive) or undetectable (ArgBP2 negative) expression. ArgBP2-positive colonies are more compacted and less dispersed than ArgBP2-negative colonies.