FIGURE 3.
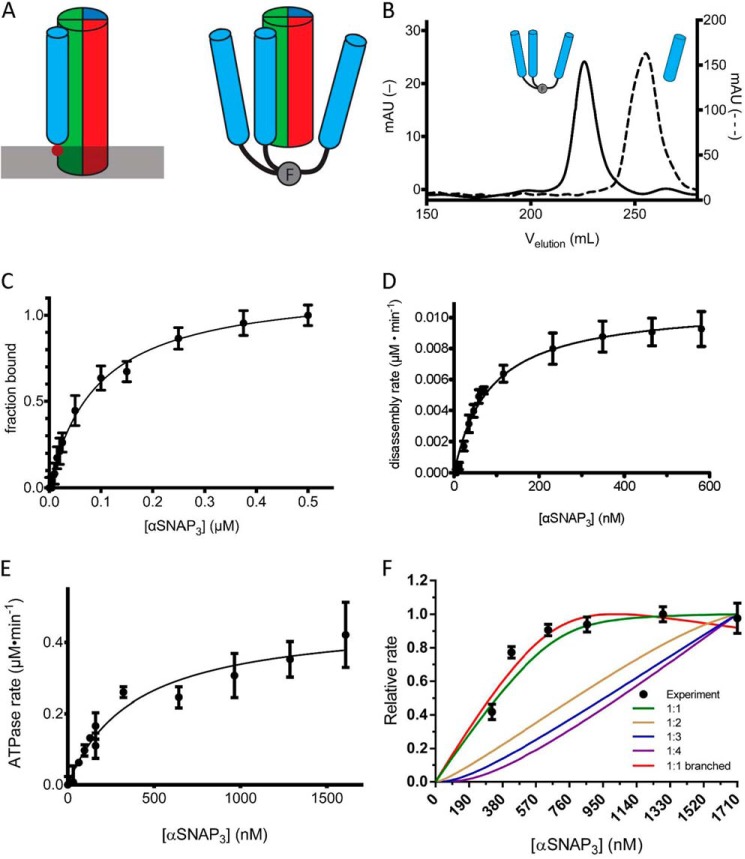
An engineered trimeric αSNAP binds to the SNARE complex, activates NSF ATPase, and mediates more efficient disassembly of the SNARE complex. A, schematic model of αSNAP interaction with the SC. The membrane is indicated by a gray bar, and the membrane-interacting loop of αSNAP is indicated by the solid red circle. The T4-foldon trimer is indicated by F. The N-terminal fusion of the trimer to αSNAP may mimic the orientation of αSNAP on the membrane. B, comparison of the A280 signal in milliabsorbance units from size exclusion chromatography (S200) elution profiles of αSNAP3 (solid, left y axis) and αSNAP (dashed, right y axis). C, SC containing labeled VAMP2 (A488; 0.05 μm) was combined with increasing concentrations of αSNAP3 (0–0.5 μm), and the change in fluorescence anisotropy was measured. The data are shown fit to a single-site binding curve giving KdαSNAP·SC = 100 ± 4 nm. D, initial rates of SC disassembly in steady-state conditions were measured in increasing concentrations of αSNAP3 (0–590 nm). The data are fit to the equation, ν = Vmax/(1 + (Km/[αSNAP])) to give the maximal rate kcat and KmαSNAP3 for SC disassembly (solid black line) (Table 2). E, the ATPase activity of NSF was measured as a function of αSNAP3 concentration. The data are fit to the equation, ν = Vmax/(1 + (Km/[αSNAP])) (solid black line) to give KmαSNAP3 for NSF ATPase activity. F, SC disassembly rates (y axis) were measured with SC and NSF at fixed concentrations (280 nm) over a range of αSNAP3 concentrations (320–1710 nm). The lines correspond to models with different αSNAP3 stoichiometry, as indicated in the key. The steeper rise for the branched curve as compared with the unbranched curve results from the normalization of the calculated data to the maximum rate. Because the branched curve has a lower absolute maximum rate than the unbranched curve, it reaches its maximum more quickly. Descriptions of the models used can be found under “Experimental Procedures.” Error bars, S.E.

