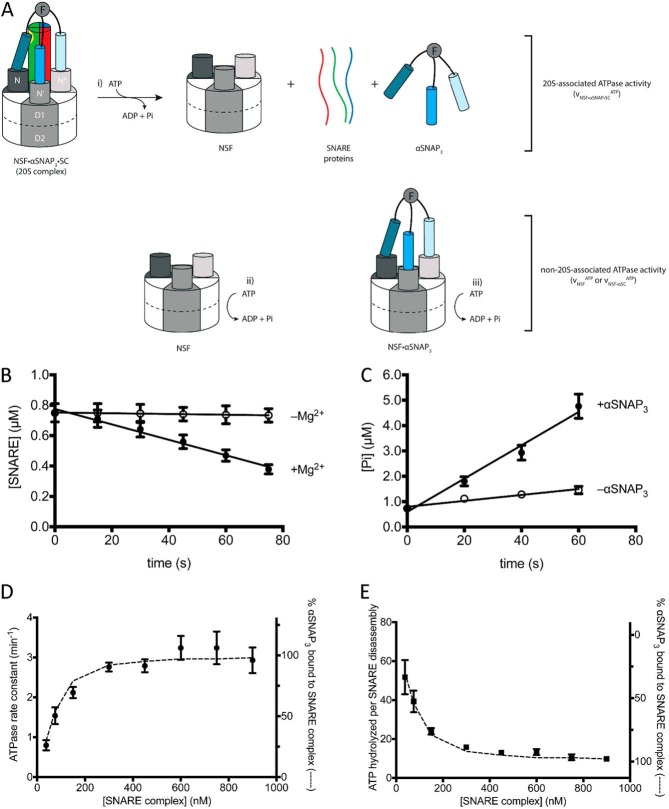
FIGURE 5.
Pre-steady-state analysis of NSF ATP hydrolysis and SNARE disassembly. A, NSF hydrolyzes ATP in the NSF·αSNAP·SC (20 S) complex, leading to SC disassembly (i), and outside the 20 S complex (ii and iii). B, SC disassembly in the presence (filled circles) and absence (open circles) of Mg2+ (n = 3; error bars show S.E.). C, ATP hydrolysis in the presence (filled circles) and absence (open circles) of αSNAP3. C and D, a representative pre-steady-state experiment ([NSF] = 1.96 μm, [αSNAP3] = 100 nm, [SC] = 750 nm) (n = 3; error bars show S.E.) used to obtain reaction rates. D, pre-steady-state disassembly and ATP hydrolysis experiments were performed at different SC concentrations (38–900 nm), and the rate constant for ATP hydrolysis versus SC concentration is plotted with the full data from Table 4. The percentage of αSNAP3 in the αSNAP3·SC complex in each experiment (dashed line, right y axis) was calculated from experimental protein concentrations and the independently determined dissociation constant of KdαSNAP·SC = 100 nm (see “Experimental Procedures”) (error bars show propagated uncertainty in the linear regression of ATP hydrolysis and SC disassembly measurements in B and C above). E, the number of ATPs hydrolyzed per SC disassembly are plotted versus SC concentration of each experiment (data points, left y axis). The percentage of αSNAP3·SC fits the data points well (dashed line, right y axis). Error bars, propagated uncertainty in the calculation of ATP per SC.

