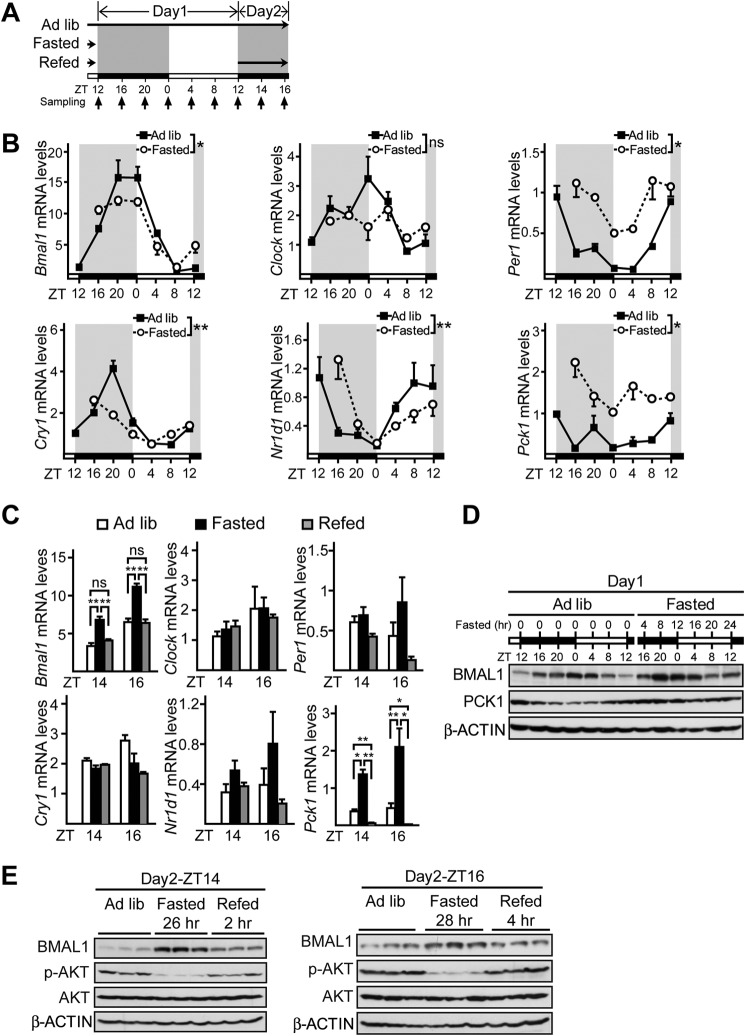
FIGURE 1.
Temporal analysis of hepatic BMAL1 expression in response to fasting and refeeding signals. A, experimental schedule of fasting and refeeding experiments. Mice were subjected to fasting (from Day1-ZT12 to Day2-ZT16) and refeeding (from Day2-ZT12 to Day2-ZT16), or kept under ad libitum (Ad lib), and sacrificed at the time points indicated by the small arrows. White bars indicate the light phase. Black bars indicate the dark phase. Long black arrow indicates food availability. B, quantitative PCR analysis of mRNA levels of Bmal1, Clock, Per1, Cry1, Nr1d1, and Pck1 (n = 3) in mice fed ad libitum, fasted for 4, 8, 12, 16, 20, or 24 h (from ZT12). *, p < 0.05, two-way analysis of variance, **, p < 0.01, two-way analysis of variance, ns, no significance. C, quantitative PCR analysis of mRNA levels of Bmal1, Clock, Per1, Cry1, Nr1d1, and Pck1 (n = 3) in mice fed ad libitum, fasted for 26 and 28 h, or refed for 2 and 4 h (from Day2-ZT12).D, immunoblot analysis of BMAL1 protein amounts (n = 3) in mice fed ad libitum and fasted. Tissues from three mice per time point were homogenized and pooled together for immunoblot analysis. E, immunoblot analysis of BMAL1 protein amounts in liver protein extracts at Day2-ZT14 and Day2-ZT16. p-AKT, phospho-AKT. Data are represented as mean ± S.E., *, p < 0.05, **, p < 0.01, ns, no significance. White and dark bars indicate light and dark phases, respectively.

