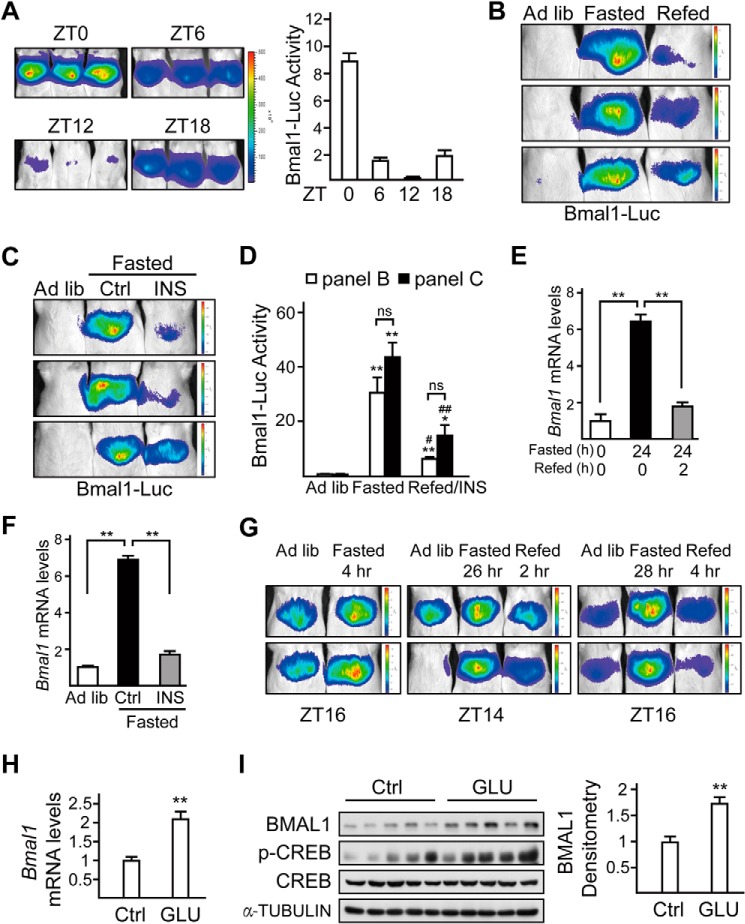
FIGURE 2.
Fasting and refeeding signals modulate hepatic Bmal1 expression via glucagon and insulin, respectively. A, imaging analysis of the hepatic activity of adenoviral luciferase reporter driven by Bmal1 promoter (Bmal1-Luc) in mice fed ad libitum at ZT0, ZT6, ZT12, and ZT18. Luciferase activity was normalized to co-infected Ad-RSV-β-gal reporter activity in the liver (right, n = 3 per group). B, in vivo imaging analysis of Ad-Bmal1-Luc reporter activity in mice fed ad libitum (Ad lib), 24-h fasted (from Day1-ZT10), or 2-h refed (from Day2-ZT8). C, imaging analysis of the hepatic activity of Bmal1-Luc in mice fed ad libitum AND fasted for 22 h (from ZT12) followed by 2-h injection of saline (Ctrl) or insulin (INS, 0.5 units/kg). D, bar graph showing relative Ad-Bmal1-Luc activity in B and C. Luciferase activity was normalized to co-infected Ad-RSV-β-gal reporter activity in the liver (n = 3 per condition, * as compared with Ad lib group, # as compared with fasted group, ns, no significance). E, the effects of fasting (from Day1-ZT10) and refeeding (from Day2-ZT8) on hepatic mRNA levels of Bmal1 (n = 3). F, quantitative PCR analysis of Bmal1 mRNA levels in mice fed ad libitum, fasted for 22 h (from ZT12) followed by 2-h injection of saline (Ctrl) or insulin (0.5 units/kg). G, in vivo imaging analysis of Ad-Bmal1-Luc reporter activity in mice fed ad libitum, fasted for 4, 26, and 28 h (from Day1-ZT12), or refed for 2 and 4 h (from Day2-ZT12) relative to Fig. 1. H and I, quantitative PCR analysis of Bmal1 mRNA level (H) and immunoblot analysis of BMAL1 protein amounts (left, n = 5) and densitometry analysis of BMAL1 protein (right, I) in mice injected with glucagon (GLU, 100 μg/kg) for 4 h (from ZT4) or saline (Ctrl). p-CREB, phospho-CREB. Data are represented as mean ± S.E., *or # p < 0.05, **or ## p < 0.01.

