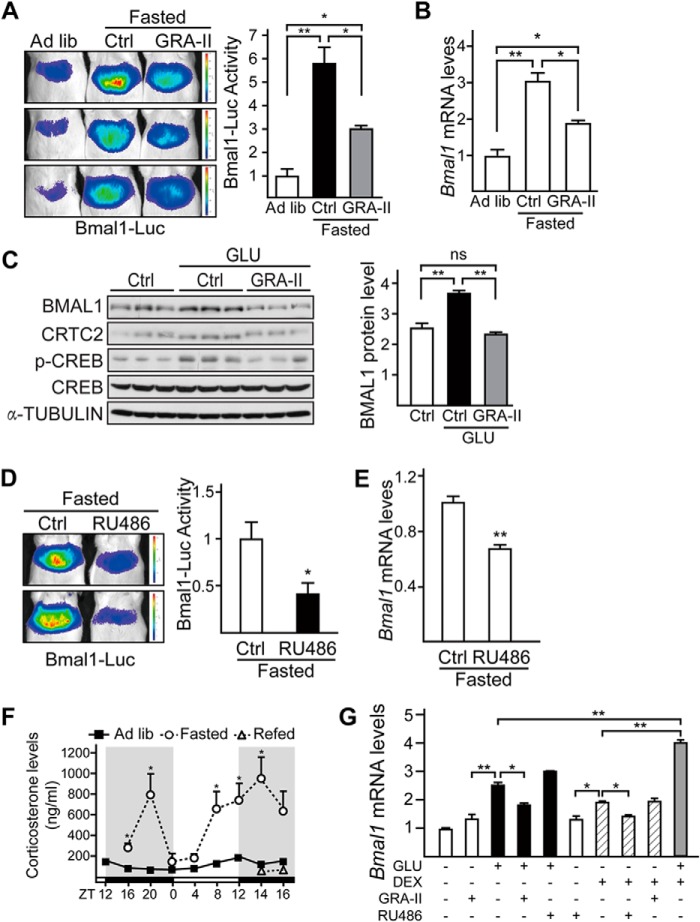
FIGURE 3.
Fasting induces Bmal1 expression through glucagon and glucocorticoid signaling pathways. A and B, in vivo imaging analysis of Ad-Bmal1-Luc reporter activity (A) and quantitative PCR analysis of Bmal1 mRNA levels (B) in mice fed ad libitum (Ad lib), 4-h fasted (from ZT12) with 2-h pre-injection of GRA-II (10 mg/kg) or saline (Ctrl). Luciferase activity was normalized to co-infected Ad-RSV-β-gal reporter activity in the liver (n = 3 per condition). C, immunoblotting analysis of BMAL1 protein (left) in primary mouse hepatocytes pretreated with GRA-II (50 μg/ml) for 2 h and followed by 4-h glucagon (GLU, 100 nm) stimulation and densitometry analysis of BMAL1 protein levels (right). (n = 3 per condition, ns, no significance). p-CREB, phospho-CREB. D and E, imaging analysis of hepatic Bmal1-Luc activity (D) and quantitative PCR analysis of Bmal1 mRNA levels (E) in mice fasted for 4 h (from ZT12) with 2-h pre-injection of glucocorticoid-receptor antagonist (RU486, 10 mg/kg) or saline (Ctrl). Luciferase activity was normalized to co-infected Ad-RSV-β-gal reporter activity in the liver. (n = 3). F, the effect of fasting and refeeding on plasma corticosterone levels relative to Fig. 1. G, quantitative PCR analysis of Bmal1 mRNA levels (n = 3) in primary mouse hepatocytes exposed to glucagon (GLU, 100 nm), dexamethasone (DEX, 100 nm), GRA-II (20 nm), or RU486 (20 nm) as indicated. Data are represented as mean ± S.E., * p < 0.05, ** p < 0.01.

