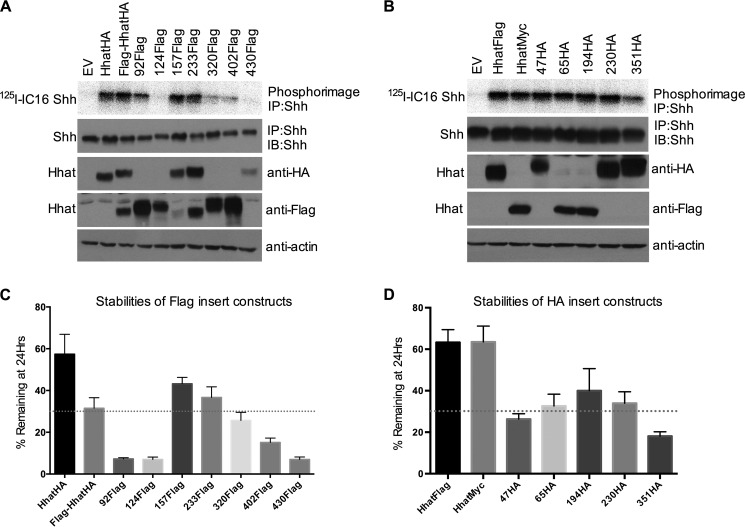
FIGURE 5.
Activity and stability of constructs used to map the topology of Hhat. A and B, COS-1 cells co-expressing Shh and Hhat with the indicated FLAG insert (A) or HA insert (B) were labeled with [125I]iodopalmitate ([125I]IC16) for 4 h. Cell lysates were immunoprecipitated (IP) with anti-Shh antibody and analyzed by SDS-PAGE and phosphorimaging (top panels) or Western blotting (IB) with anti-HA, anti-FLAG, anti-Myc, or anti-actin antibodies. The experiment was performed 3 times in duplicate; a representative image is shown. C and D, COS-1 cells expressing the indicated FLAG insert (C) or HA insert (D) Hhat constructs were treated with 100 μg/ml cycloheximide and 40 μg/ml chloramphenicol for 0 h or 24 h. Cells were lysed and analyzed by Western blotting with an antibody directed against the C-terminal tag (anti-HA, anti-FLAG, or anti-Myc) after SDS-PAGE. The amount of Hhat signal at each time point was determined by densitometry. Each point indicates the mean ± S.D. (n = 3).

