FIGURE 2.

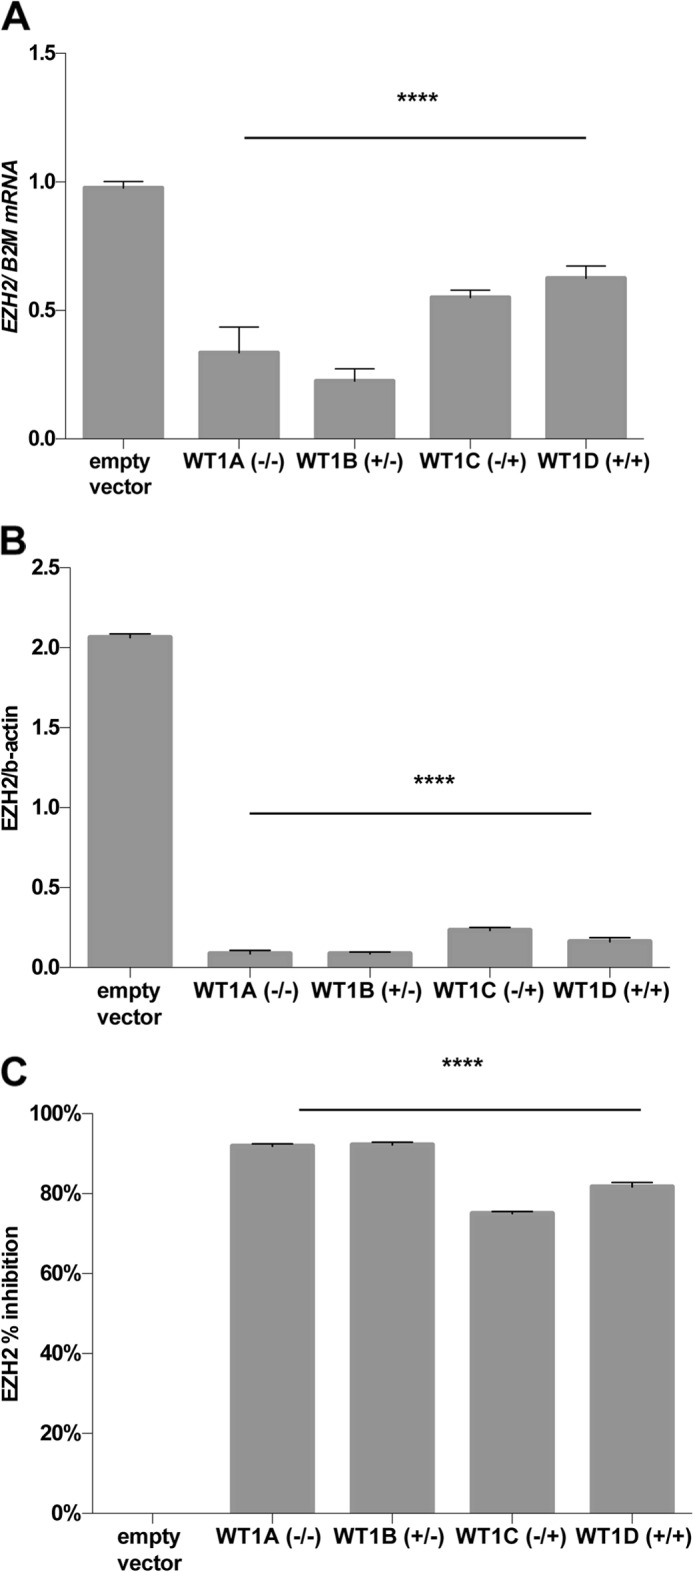
Effect of WT1 on endogenous EZH2 expression. A, EZH2 mRNA was quantified (n = 4) by qRT-PCR with β2-microglobulin (B2M) as the reference transcript in amMSC stably transfected with each of the four major WT1 isoforms. B, EZH2 protein levels were quantified by densitometric analysis of Western immunoblots (n = 4) in each stably transfected amMSC line normalized to β-actin. C, the percentage of inhibition of EZH2 expression was adjusted for relative levels of WT1 protein in each cell line; the two WT1−KTS lines (WT1A and WT1B) gave similar inhibition (92%) of EZH2 as compared with the empty vector control (not significant), whereas WT1+KTS isoforms (WT1C and WT1D) were slightly less effective (75 and 82% inhibition, respectively). ANOVA with post hoc t tests, p < 0.0001 (****).
