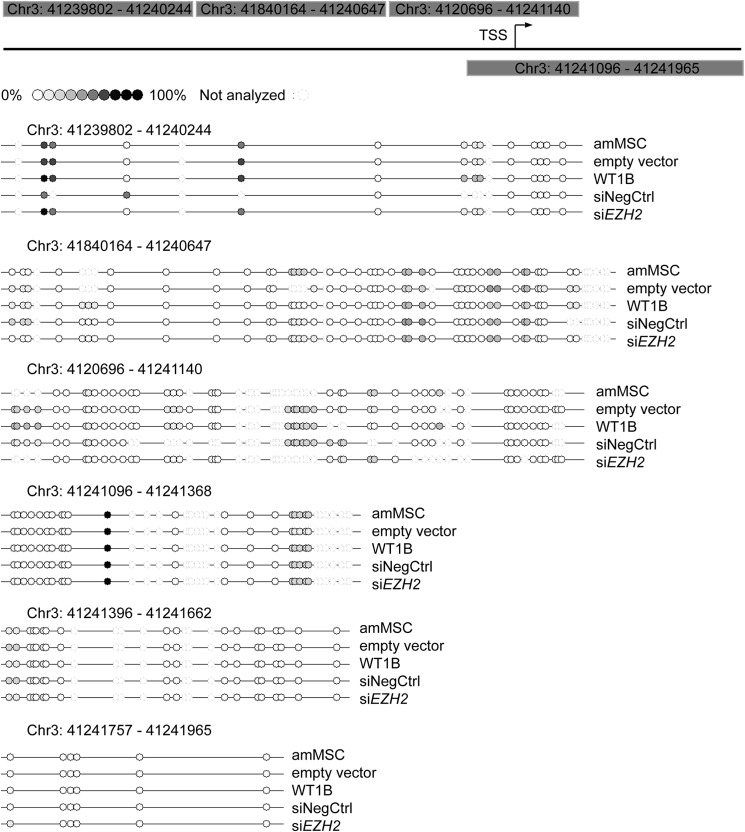
FIGURE 5.
DNA methylation analysis of CTNNB1 5′-flanking region. A 2-kb fragment including the 5′ upstream sequence of CTNNB1 and part of the first exon was analyzed for the DNA methylation pattern in parental amMSC and amMSC with empty vector control versus amMSCWT1B or amMSC transiently transfected with siEZH2 versus siRNA negative control (siNegCtrl). Circles denote the approximate location of the CpGs analyzed by bisulfite analysis. Color gradient marks degree of methylation. TSS, transcription start site.

