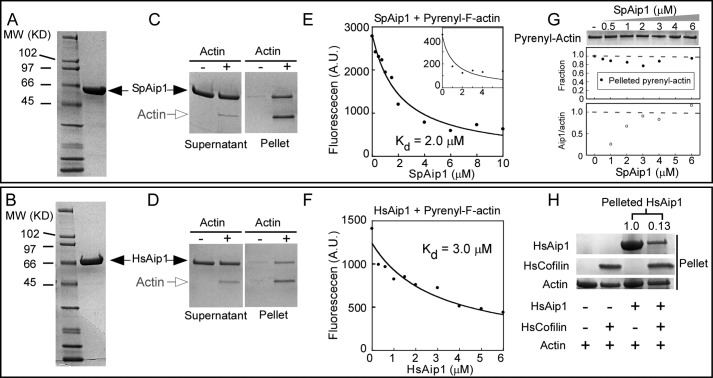
FIGURE 1.
Fission yeast SpAip1 and human HsAip1 bind actin filaments. A and B, SDS-PAGE of standards and purified SpAip1 (A) and HsAip1 (B) stained with Coomassie Blue. C and D, cosedimentation of Aip1 with actin filaments. Samples of 1.5 μm SpAip1 (C) or 1.5 μm HAip1 (D) were incubated with 1 μm actin filaments for 1 h and then centrifuged at 100,000 × g for 25 min. Supernatant and pellet samples were analyzed by SDS-PAGE and stained with Coomassie Blue. The SpAip1 samples were twice the volumes of the HsAip1 samples. E and F, fluorescence quenching to measure equilibrium binding of a range of concentrations of SpAip1 (E) or HsAip1 (F) to 1 μm 100% labeled pyrenyl-actin filaments in KMEI buffer at 25 °C. The smooth curves are fits of the binding equation to the data yielding Kd values of 2.0 μm for SpAip1 and 3.0 μm for HsAip1. The inset in E shows fluorescence quenching of 1 μm 20% pyrenyl-actin filaments SpAip1 with the best fit (smooth curve) yielding a Kd of 1.2 μm. G, pelleting assay: 1 μm 94% labeled pyrenyl-actin filaments were incubated with a range of concentrations of SpAip1 and centrifuged at 100,000 for 25 min. Actin in the pellet samples were analyzed by SDS-PAGE and stained with Coomassie Blue (top panel) and quantified using NIH ImageJ (middle panel). The ratio of SpAip1 to actin in the pellet samples was quantified to measure the stoichiometry between SpAip1 and actin (bottom panel). H, pelleting assay: 2 μm actin filaments were incubated with either 15 μm HsCofilin or 10 μm HsAip1 or both and centrifuged at 100,000 × g for 1 h. Pellet samples were analyzed by SDS-PAGE and stained with Coomassie Blue. The intensities of the HsAip1 bands were quantified with NIH ImageJ.

