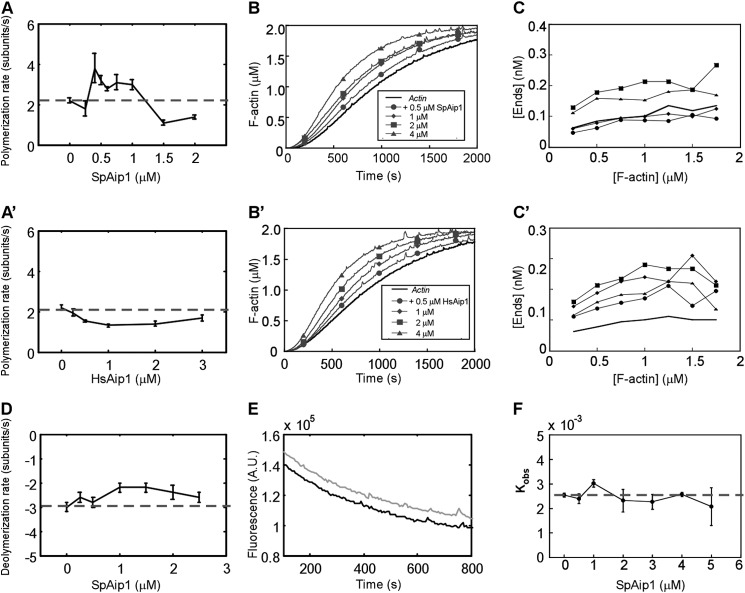
FIGURE 2.
Effects of Aip1 on actin polymerization. A and A′, dependence of the rate of barbed end elongation of 0.5 μm Mg-ATP-actin on the concentration of SpAip1 (A) and HsAip1 (A′) measured by TIRF microscopy. The error bars are ±1 standard deviation of the mean elongation rates of at least 10 filaments. The dashed line is the polymerization rate of actin alone. The dashed line is the polymerization rate of actin alone. B and B′, time course of spontaneous polymerization measured by fluorescence of 2 μm Mg-ATP-actin (10% pyrene-labeled) with a range of concentrations of SpAip1 (B) or HsAip1 (B′). C and C′, concentrations of actin filament barbed ends as actin polymerized in B and B′, taking into account the elongation rates measured in A and A′. D, dependence of barbed end depolymerization rates on the concentration of SpAip1, measured by TIRF microscopy. Filaments were grown in the observation chamber from 0.5 μm Mg-ATP-actin monomers in the presence of SpAip1, followed by replacement with SpAip1 in polymerization buffer without actin monomers. The error bars are ±1 standard deviation of the mean elongation rate of at least 10 filaments. E, time course of depolymerization of pyrenyl-actin filaments diluted to 0.1 μm in KMEI buffer at 25 °C with no SpAip1 (black line) or with 400 nm SpAip1 (gray line). The dashed line is the depolymerization rate of actin alone. F, the depolymerization rate constants of 0.1 μm pyrenyl-actin filaments over a range of concentrations of SpAip1. The dashed line is the depolymerization rate of actin alone. The error bars are ±1 standard deviation of the mean depolymerization rates.

