FIGURE 7.
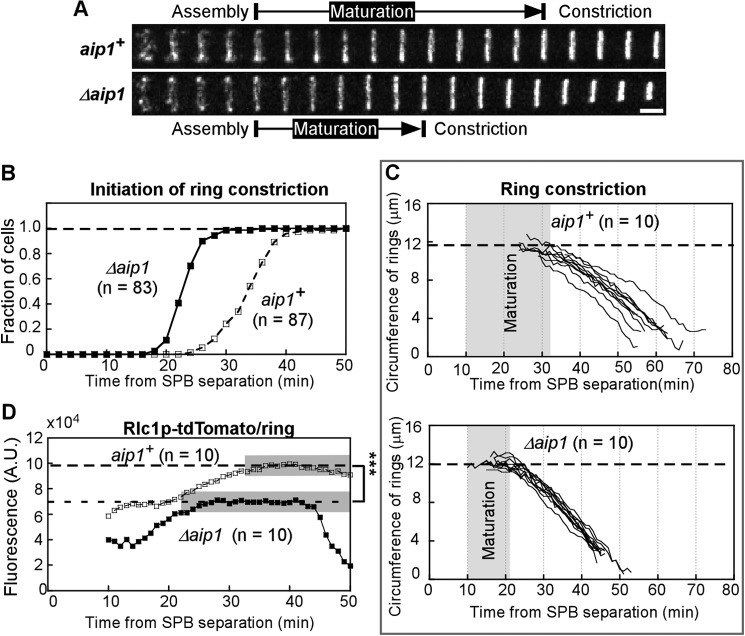
Analysis of contractile ring constriction in wild type and Δaip1 mutant cells expressing Rlc1p-tdTomato and Sad1p-mGFP, related to Table 3. A, time series at 2 min interval of fluorescence micrographs (maximum intensity projections of Z-series of whole cells) of the division plane of a wild type (aip1+) and Δaip1 cell during cytokinesis. Bar, 2 μm. B, outcomes plot of the accumulation of cells that have initiated the constriction of contractile rings after the separation of SPBs (time 0). Open squares, wild type cells; filled squares, Δaip1 cells. C, time courses of circumferences of constricting rings in wild type cells (top panel) and Δaip1 cells (bottom panel). The dashed line is the average circumference of fully formed contractile rings. The period of ring maturation is shaded gray. D, average fluorescence intensities of Rlc1p-tdTomato in contractile rings over time after spindle pole body separation (n = 10). The period of ring constriction is shaded gray. Open squares, wild type cells; filled squares, Δaip1 cells. The peak fluorescence intensities (dashed lines) of Rlc1p-tdTomato in wild type contractile rings (98,000 ± 27,000, n = 50) are significantly higher than those in Δaip1 mutant rings (69,000 ± 13,000, n = 50) (p < 0.0001, two-tailed Student's test).

