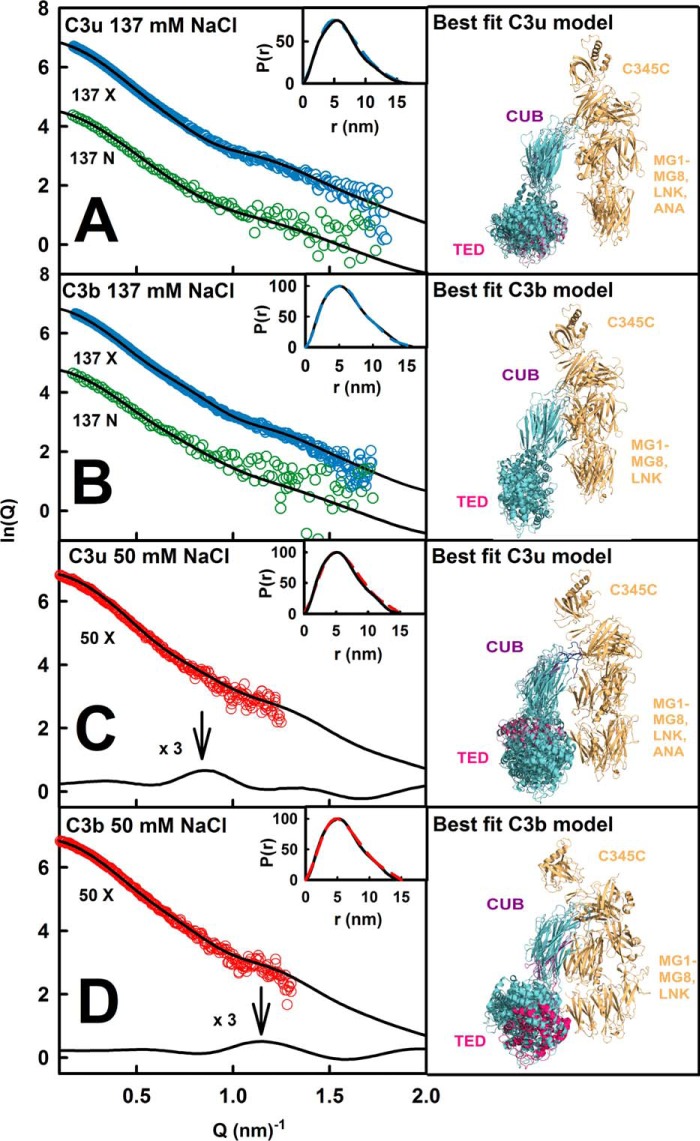
FIGURE 10.
Scattering modeling fits for C3u and C3b in three buffers. A, the x-ray and neutron fits for C3u at 0.82–1.0 mg/ml in 137 mm NaCl buffer in light and heavy water are shown in blue and green, respectively. B, the x-ray and neutron fits for C3b at 0.52–1.0 mg/ml in 137 mm NaCl buffer in light and heavy water are shown in blue and green, respectively. C, the C3u x-ray curve in 50 mm NaCl buffer in light water was extrapolated to zero concentration. Subtraction of the fitted C3u x-ray curve in 137 mm NaCl buffer revealed a peak at 0.86 nm−1. D, the C3b x-ray curve in 50 mm NaCl buffer in light water was extrapolated to zero concentration. Subtraction of the fitted C3b x-ray curve in 137 mm NaCl buffer revealed a peak at 1.14 nm−1. The insets show the experimental (continuous) and modeled (dashed) x-ray P(r) curves. The right-hand panels show the 4–6 x-ray best fitted superimposed structures in the same orientation as Fig. 1, with the best fit TED domain shown in crimson.

