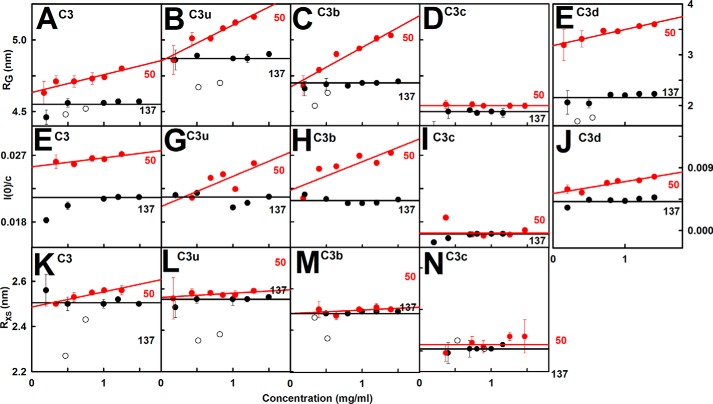
FIGURE 6.
Concentration dependence of the Guinier values. Each x-ray value is the mean of four measurements. The neutron values from D22 correspond to single measurements. A–E, x-ray Rg values are shown for 137 mm (black) and 50 mm NaCl (red) buffers. The pairs of open symbols correspond to the neutron Rg values. For 137 mm NaCl, the line denotes the mean value. For 50 mm NaCl, linear regression gave the mean ± S.D. F–J, corresponding x-ray I(0)/c analyses. K–N, corresponding x-ray and neutron Rxs values.

