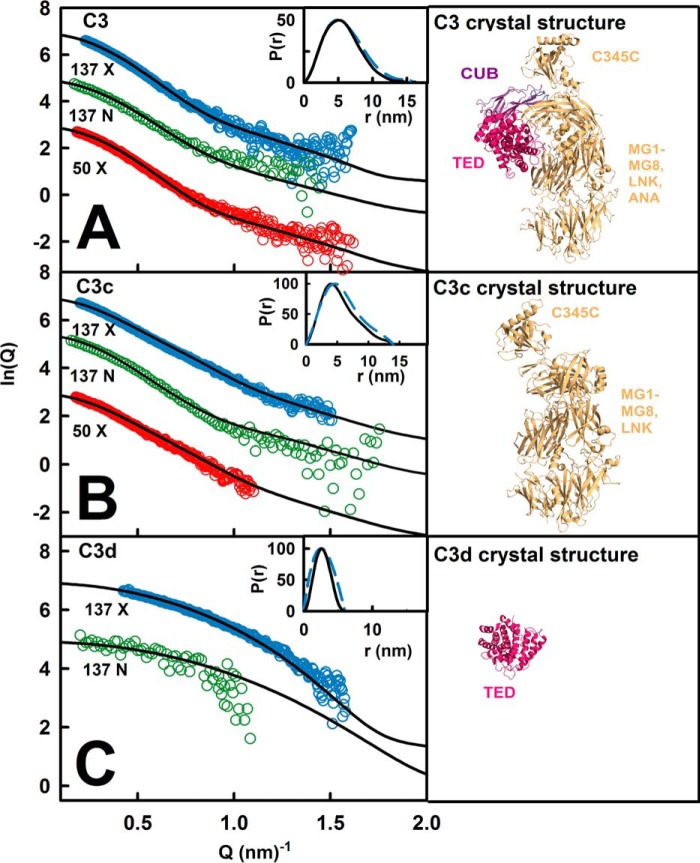
FIGURE 8.
Scattering curve fits using the C3, C3c, and C3d crystal structures. A, the three experimental curves for C3 (concentrations of 0.73–1.49 mg/ml) are shown in circles, and the black line is based on the C3 crystal structure. B, the experimental curves for C3c (1.01–1.16 mg/ml) are shown in circles, and the black line is based on the C3c crystal structure. C, the experimental curves for C3d/TED (0.50–0.59 mg/ml) are shown in circles, and the black line is based on the C3d crystal structure.

