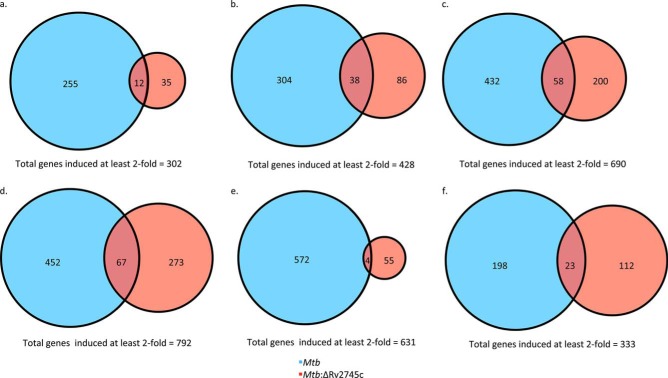
FIGURE 13.
Venn diagrams of reaeration-induced genes. Venn diagrams describe the extent of overlap between gene expression upon reaeration treatment in Mtb (blue circles) and Mtb:ΔRv2745c (red circles). Genes induced at least 2-fold at 1 h (a), 4 h (b), 6 h (c), 12 h (d), 24 h (e), and 48 h (f) post-reaeration treatment are shown. n = 3.

