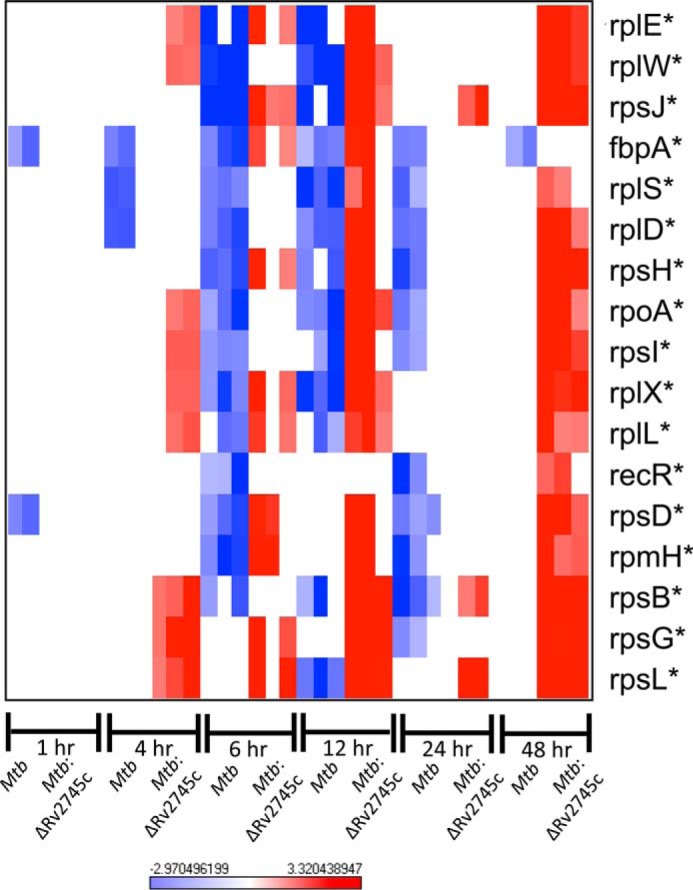
FIGURE 17.

Known and potential Clp protease targets during reaeration. The heat map shows results of supervised hierarchical clustering focusing on the genes with the highest magnitude of change. Known and potential protease targets are displayed. Genes with reduced expression levels by 6 and 12 h post-reaeration but expressed in the mutant at either 4, 6, or 12 h post-reaeration were identified as potential Clp protease targets. n = 3. Red indicates induction, whereas blue indicates repression relative to the control channel. The intensity of each color corresponds to the magnitude. *, p < 0.05 for at least 1 time point.
