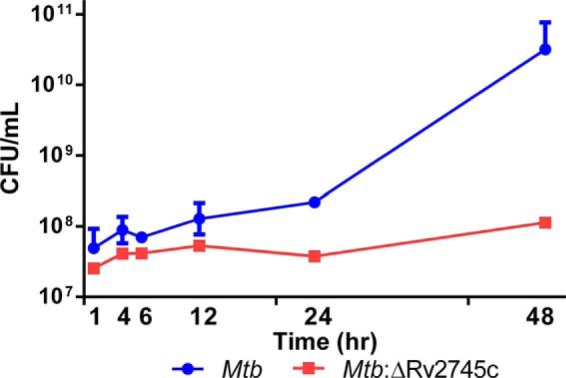
FIGURE 2.

Reaeration growth curve. During reaeration the mutant shows decreased viability up to 48 h post-reaeration, whereas the wild type continues to replicate until 48 h-post reaeration. p = 0.0313. n = 3, except at t = 48 h, n = 2 for wild type.
