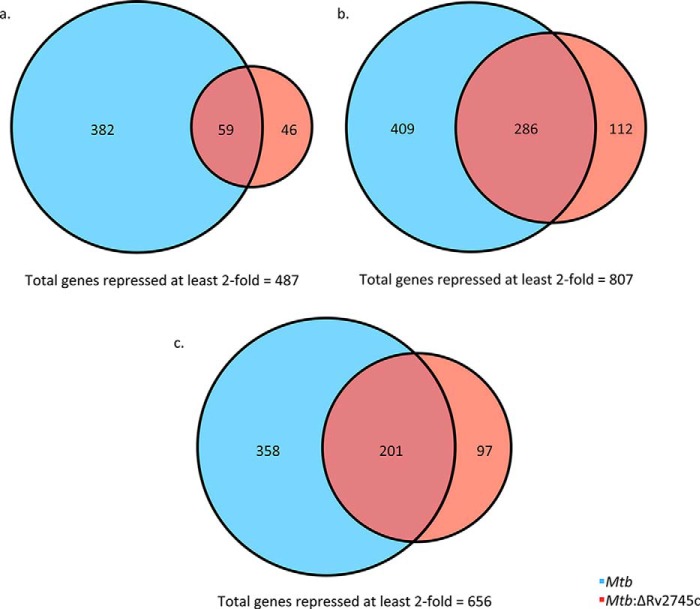
FIGURE 6.
Venn diagrams of hypoxia-repressed genes. Venn diagrams describe the extent of overlap between gene expression upon hypoxia treatment in Mtb (blue circles) and Mtb:ΔRv2745c (red circles). Genes repressed at least 2-fold at 1 day (a), 5 days (b), and 7 days (c) post-hypoxia treatment are shown. n = 3.

