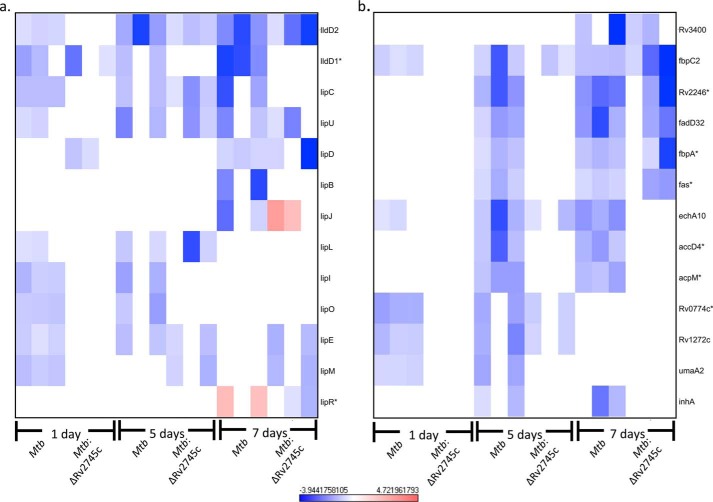
FIGURE 9.
Fatty acid metabolism and mycolic acid synthesis repression during hypoxia. Heat maps show the results of supervised hierarchical clustering focusing on the genes with the highest magnitude of change. Shown are fatty acid metabolism (a) and mycolic acid synthesis genes (b). Genes involved in fatty acid metabolism and mycolic acid synthesis were repressed in Mtb during the initial stages of hypoxia, whereas only a subset of these genes were repressed in Mtb:ΔRv2745c at later stages of hypoxia indicating that Rv2745c plays a differential regulatory role in a condition-dependent manner via direct or indirect regulation. n = 3. Red indicates induction, whereas blue indicates repression relative to the control channel. The intensity of each color corresponds to the magnitude. *, p < 0.05 for at least 1 time point.

