
FIGURE 1.
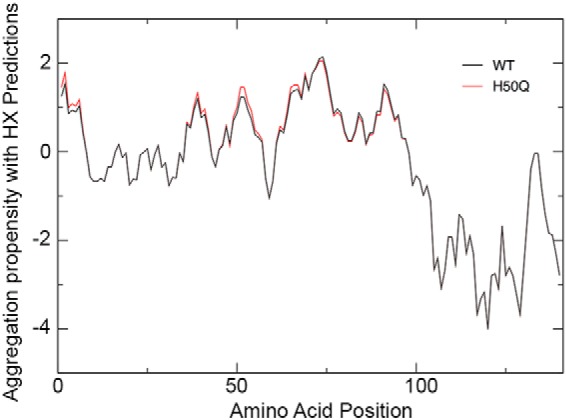
Prediction of aggregation propensity of WT and H50Q α-Syn. Shown are CamP-corrected aggregation profiles of WT (black) and H50Q α-Syn (red) as calculated with the Zyggregator method (23). HX, hydrogen exchange.
Official websites use .gov
A
.gov website belongs to an official
government organization in the United States.
Secure .gov websites use HTTPS
A lock (
) or https:// means you've safely
connected to the .gov website. Share sensitive
information only on official, secure websites.
Prediction of aggregation propensity of WT and H50Q α-Syn. Shown are CamP-corrected aggregation profiles of WT (black) and H50Q α-Syn (red) as calculated with the Zyggregator method (23). HX, hydrogen exchange.