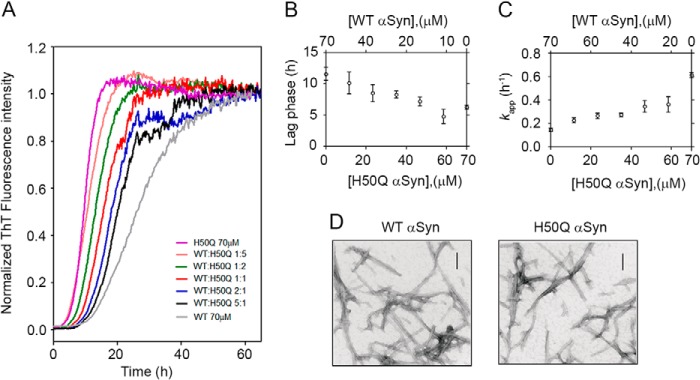
FIGURE 3.

Mutual effect of WT and H50Q α-Syn on the aggregation kinetics. A, normalized data of mixtures of WT/H50Q α-Syn at 1:5 (orange), 1:2 (green), 1:1 (red), 2:1 (blue), and 5:1 (black) molar ratios, respectively. Curves at 70 μm of WT (gray) and H50Q (purple) were also included. B, effect of increasing concentration of H50Q (or WT) α-Syn on the lag time of aggregation. C, effect of increasing concentration of H50Q (or WT) α-Syn on the kapp of aggregation. Means ± S.D. of at least three independent experiments are shown. D, microscopic analysis of in vitro fibrils of WT and H50Q α-Syn. Scale bars, 100 nm.
