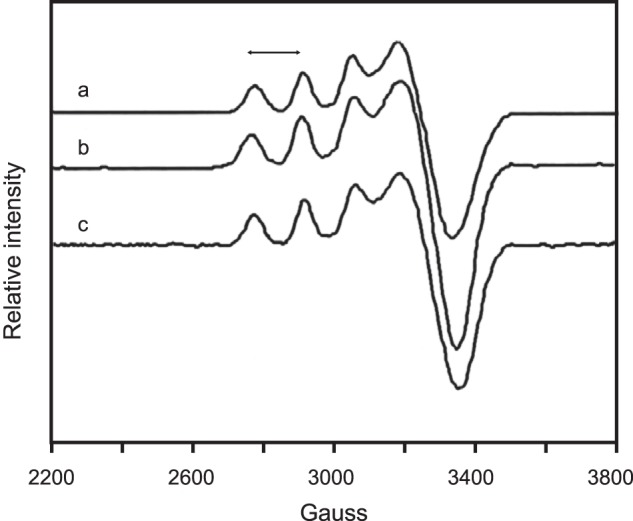
FIGURE 9.

EPR shows copper binding and environment are similar in C57S and wild type human SOD1. The spectra were taken at 97 K in 100 mm phosphate buffer, pH 7.4. Spectrum a, as-isolated hWT SOD1 (g⊥, 2.078; A‖, 139); spectrum b, copper-titrated as-isolated C57S SOD1 (C57S Cu2Zn2 hSOD1) (g⊥, 2.070; A‖, 140); spectrum c, as-isolated C146R SOD1 (g⊥, 2.0758; A‖, 145). The double-headed arrow denotes A‖.
