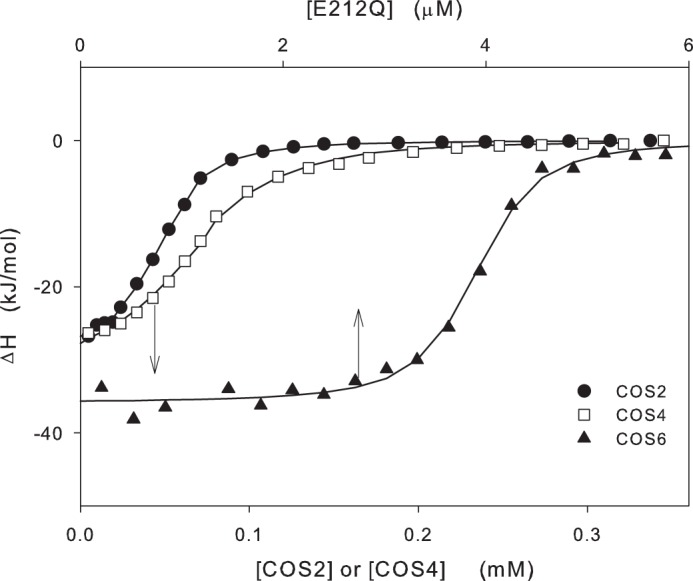
FIGURE 2.

Examples of raw data from the calorimetric measurements at 10 °C. Areas of injection peaks were normalized with respect to the amount of injectant delivered to get the enthalpy change in kJ/(mol injectant) and plotted as a function of the concentration of the injectant. In the experiments with COS2 and COS4 (lower abscissa), 42 μm enzyme (E212Q) in the calorimetric cell was titrated with doses of 2 mm COS ligand. For COS6 (upper abscissa), the experiment was conducted in the opposite way with the COS ligand (4 μm) in the calorimetric and 132 μm E212Q solution in the syringe. This difference in the procedure for, respectively, short and long COS ligands was dictated by solubility limitations (see “Experimental Procedures”). The lines show the best fits of a simple binding model based on one set of equal and independent binding sites.
