
FIGURE 5.
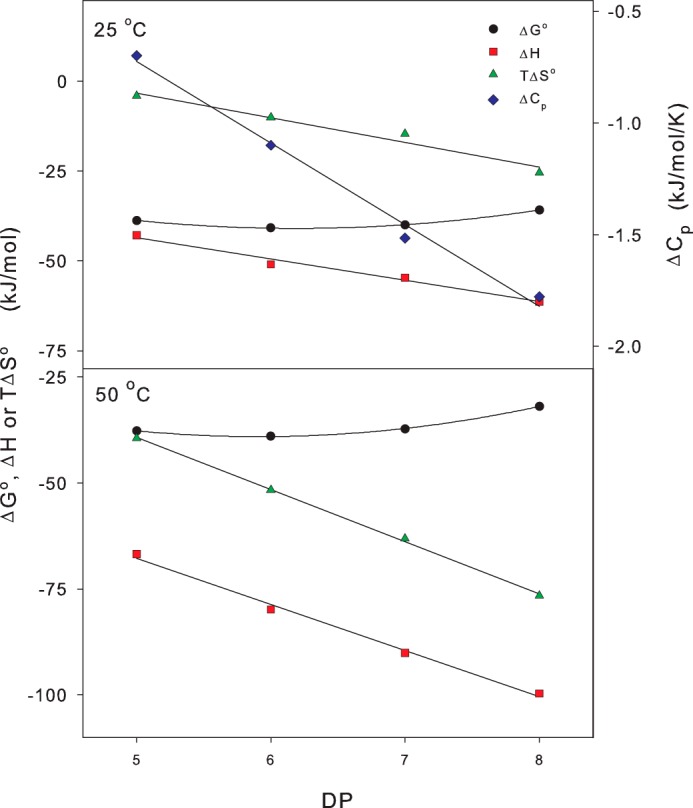
Thermodynamic data from Fig. 4 at 25 °C and 50 °C, respectively, plotted as a function of the ligand size (DP). The heat capacity change, ΔCp, was independent of temperature and is only plotted in the (25 °C).
Official websites use .gov
A
.gov website belongs to an official
government organization in the United States.
Secure .gov websites use HTTPS
A lock (
) or https:// means you've safely
connected to the .gov website. Share sensitive
information only on official, secure websites.
Thermodynamic data from Fig. 4 at 25 °C and 50 °C, respectively, plotted as a function of the ligand size (DP). The heat capacity change, ΔCp, was independent of temperature and is only plotted in the (25 °C).