FIGURE 6.
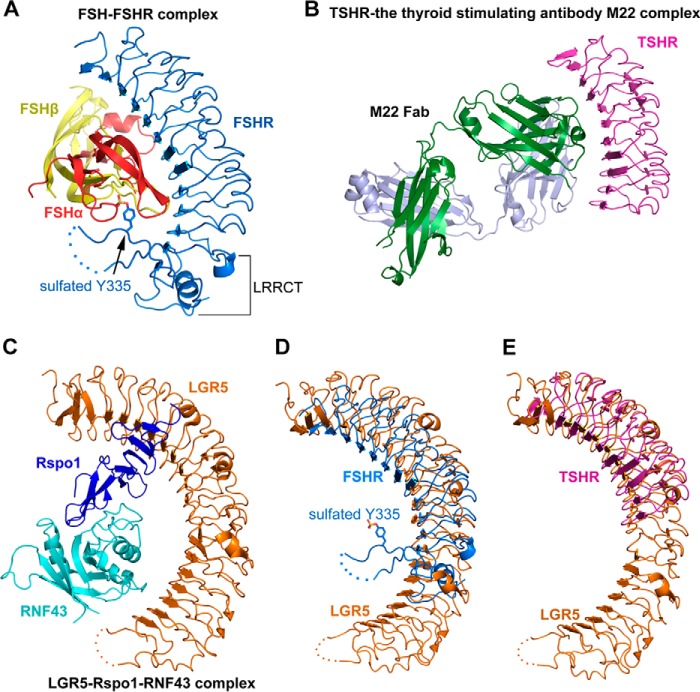
Structural comparison of the receptor-ligand complexes of LGR1, LGR3, and LGR5. A, crystal structure of FSH-FSHR (LGR1) complex (PDB code 4AY9). The α- and β-chain of FSH are colored in red and yellow, respectively. FSHR (LGR1) are colored in blue. The sulfated Tyr-335 is shown as sticks. The disordered region in the LRRCT/hinge region of FSHR is shown as dashed lines. B, crystal structure of TSHR (LGR3) in complex with the thyroid-stimulating antibody M22 (PDB code 3G04). The two chains of the M22 Fab are colored in green and gray, respectively. TSHR is colored in purple. C, crystal structure of the LGR5-Rspo1-RNF43 ternary complex (PDB code 4KNG). LGR5, Rspo1, and RNF43 are colored in orange, blue, and cyan, respectively. D, structural comparison of LGR5 with FSHR (LGR1). LGR5 and FSHR are colored in orange and blue, respectively. E, structural comparison of LGR5 with the M22-bound TSHR (LGR3). LGR5 and TSHR are colored in orange and purple, respectively.

