FIGURE 3.
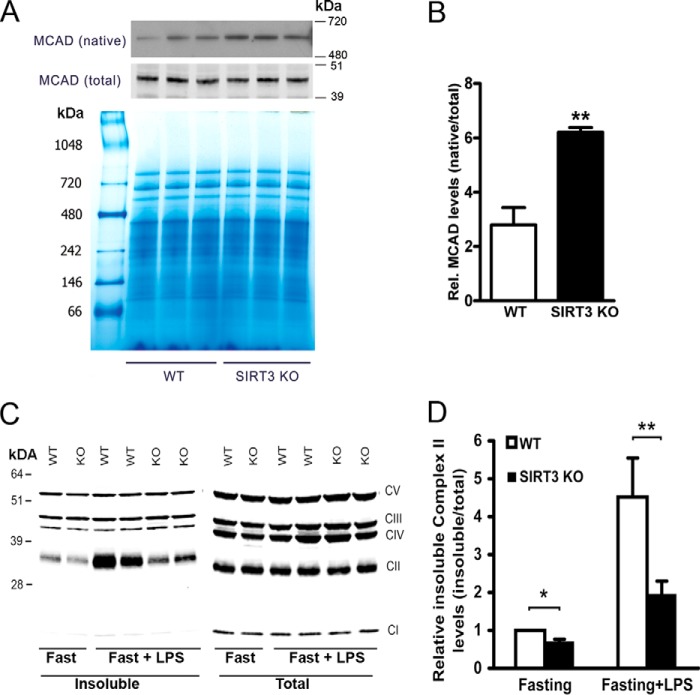
SIRT3 regulates folding of fatty acid metabolic proteins. A, Western blots showing native tetrameric MCAD levels in liver mitochondria from WT and SIRT3 KO mice using blue native gel with total MCAD as the control. MW, molecular weight. B, quantification of relative (Rel.) native MCAD levels representing three experiments. **, p <0.01. C, liver mitochondria were isolated from mice following a 24-h fast with exposure to LPS (0.5 mg/kg) or saline administered intraperitoneally 18 h into fasting. Insoluble (after 1% Nonidet P-40 treatment) and total mitochondrial complex levels were measured by Western blot analysis. CV, mitochondrial respiratory chain complex V; CIII, complex III; CIV, complex IC; CII, complex II; CI, complex I. D, histograms showing quantification of relative insoluble complex II levels from four separate experiments. **, p <0.01.

