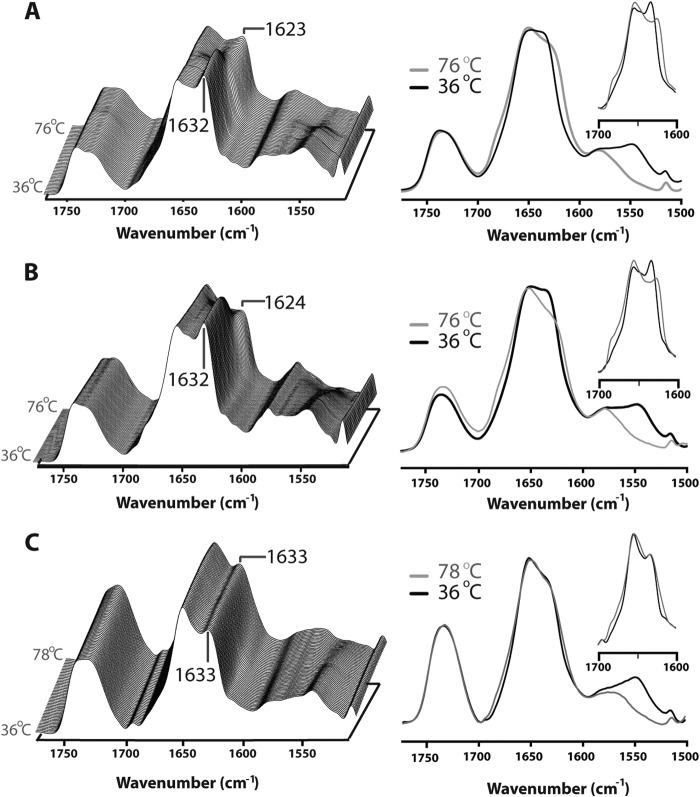
FIGURE 4.
Thermal denaturation spectra of aso-ELIC (A), PC-ELIC (B), and PC-ELIC3 (C). The left panel depicts a stacked plot of spectra collected for thermal stability characterization of the reconstituted ELIC. Representative traces are shown from 36 to 76 °C, front to back, for aso-ELIC and PC-ELIC, and from 36 to 78 °C for PC-ELIC3. Spectra were collected at 1 °C increments and deconvolved using GRAMS/AI version 7.01 software (Thermo Galactic) with γ = 7 and a Bessel smoothing function set at 70%. The right panel depicts spectra collected at 36 °C (black line) and 76 or 78 °C (gray line) showing full exchange of the N-1H to N-2H upon denaturation. Inset, deconvolved amide I bands (from 1700 to 1600 cm−1) at 36 °C (black) and 76 or 78 °C (gray).

