Fig. 1.

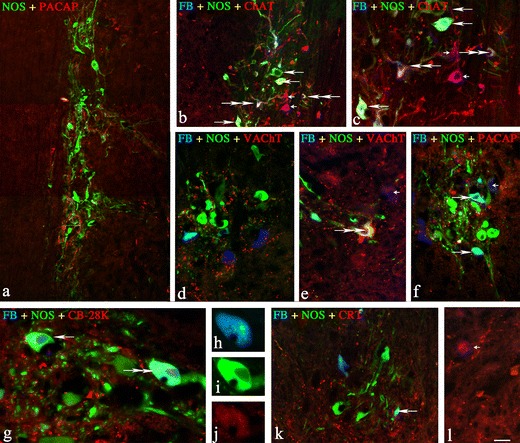
Representative images of SCG-projecting neurons located in the spinal cord IML column. All pictures are composites of merged images taken separately from the red, green, and/or blue fluorescent channels. a Double-labelled NOS+/PACAP + neurons in the Th3 neuromere, a compilation of three photos. b, c Three different populations of NOS/ChAT-positive neurons in Th3 neuromere; FB+/NOS+ neurons positive for ChAT (two double arrows), FB+/NOS + negative for ChAT (three long arrows), and double-labeled FB+/ChAT+ negative for NOS (two small arrows). d, e Single FB + neurons scattered between a small population of FB+/NOS+/VAChT + (triple staining, two double arrows) and FB+/VAChT + neurons (small arrow). f A population of double FB+/NOS+/PACAP− (two single arrows) and FB+/NOS−/PACAP + (small arrow) neurons observed in Th3 neuromere. g, j The FB+/NOS+/CB-28 k+ (one double arrow) and FB+/NOS+/CB-28 k− (single arrow) neurons observed in Th3 neuromere (merged image). Enlarged images of the triple-stained neuron, split channels: h blue—FB labeling. i Green—NOS labeling. j Red—CB-28 K labeling. k The FB+/NOS+/CRT− (single arrows) and l FB+/NOS−/CRT+ (small arrow) neurons observed in Th3 neuromere. Scale bar image 1—120 μm; images 2, 4, 6, 11, and 12—100 μm; images 3 and 5—50 μm; image 7—25 μm; images 8, 9, and 10—20 μm
