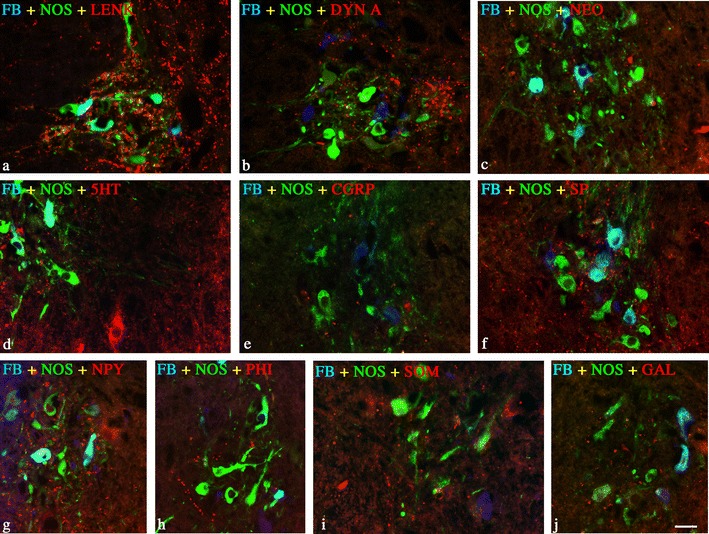
Fig. 2.

a—j Representative images of SCG-projecting FB+/NOS + neurons (SPN) and surrounding fibers observed in Th3 neuromere. All images are composites of merged images taken separately from the red, green, and blue fluorescent channels. Retrogradely labelled SPN were surrounded by a LENK-, b DYN A-, c α-NEO-IR, d 5HT-, e CGRP-, f SP-, g NPY-, h PHI-, i SOM-, j GAL-IR axons; scale bar 50 μm
