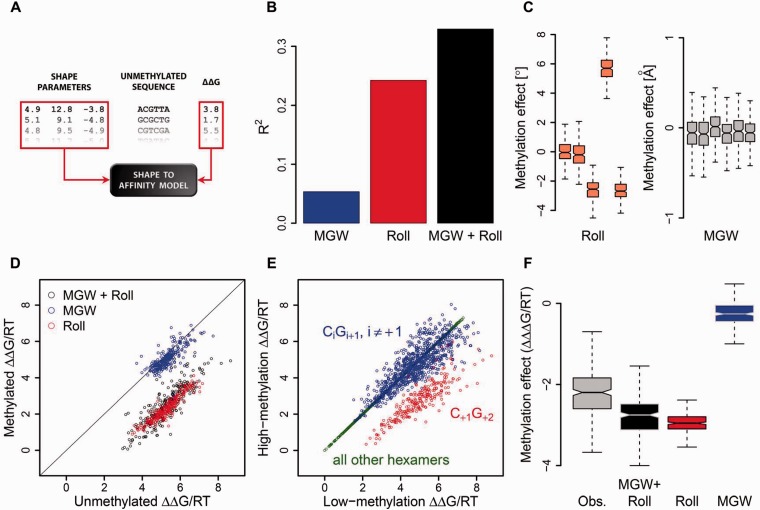
Figure 2:
Intrinsic DNA methylation sensitivity of DNase I. This figure illustrates the original analysis performed by Lazarovici et al. [63]. (A) Schematic diagram illustrating construction of the ‘shape-to-affinity model’ for predicting the binding free energy ΔΔG (logarithm of the relative cleavage rate) from DNA structural features, such as Roll and MGW. (B) Fraction of the variance in binding free energy explained by the different variants of the shape-based model when fit to all 256 unmethylated DNA sequences containing a CpG dinucleotide. (C) Effect of cytosine methylation on each shape parameter (distribution of difference for Roll and MGW values, along the leading strand of the hexamer), derived from all-atom Monte Carlo simulations [69, 70] of methylated DNA fragments. Five Roll values describe the base pair steps in a hexamer, whereas each of the six base pairs can be assigned a MGW value, as previously described [71]. (D) Change in binding free energy for each sequence, predicted from changes in shape features in (C), using the model constructed in (A). (E) Empirically observed change in binding free energy obtained from parallel methylation and DNase I profiling on genomic DNA from the same cell line. (F) Effect of methylation across all 256 nucleotide sequences, quantified as the change in ΔΔG, as empirically observed and as predicted using Roll, MGW or both.

