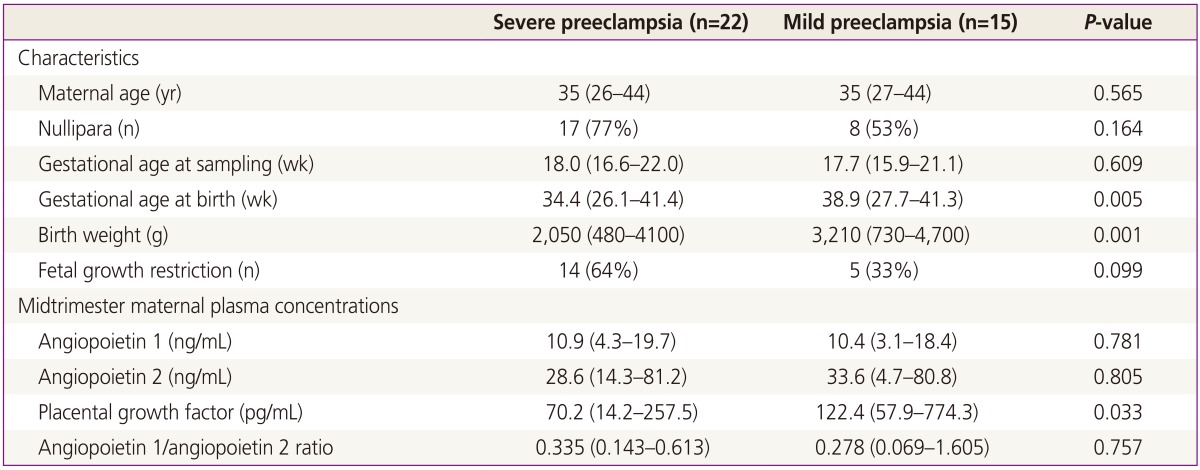
Table 3.
Subgroup data according to the severity of preeclampsia within the preeclampsia

Data were represented as median and range or number (%).
Subgroup data according to the severity of preeclampsia within the preeclampsia

Data were represented as median and range or number (%).