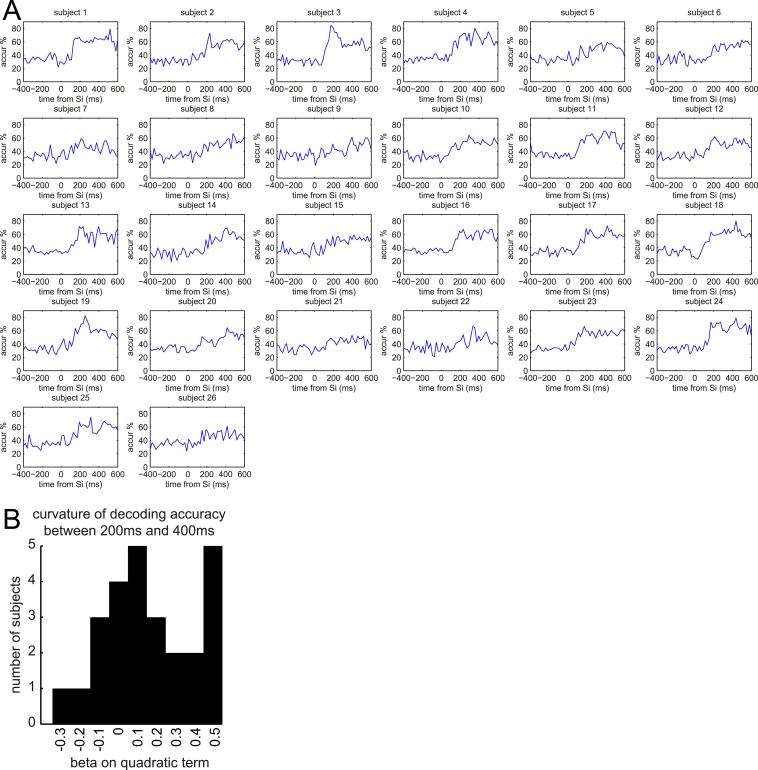
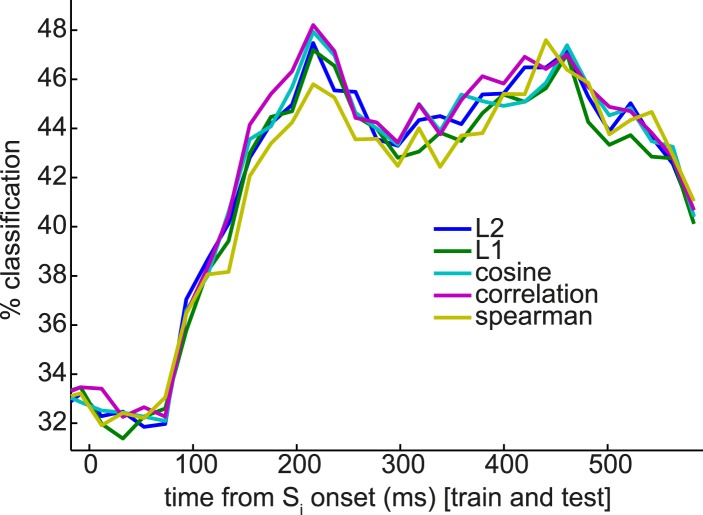
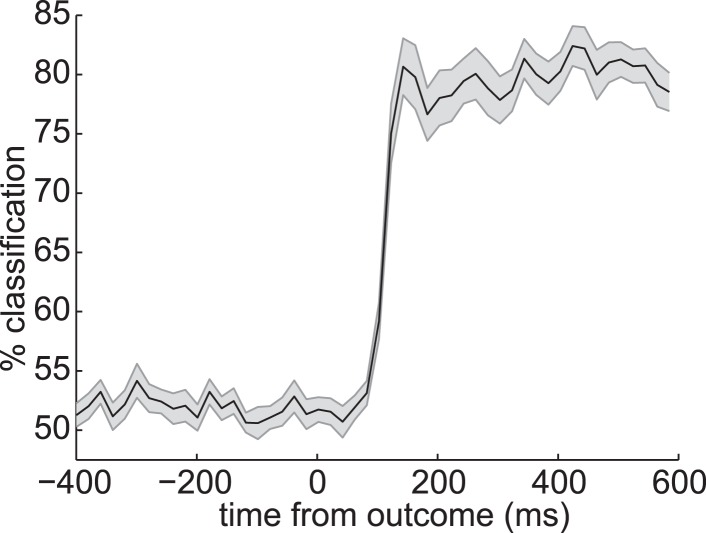
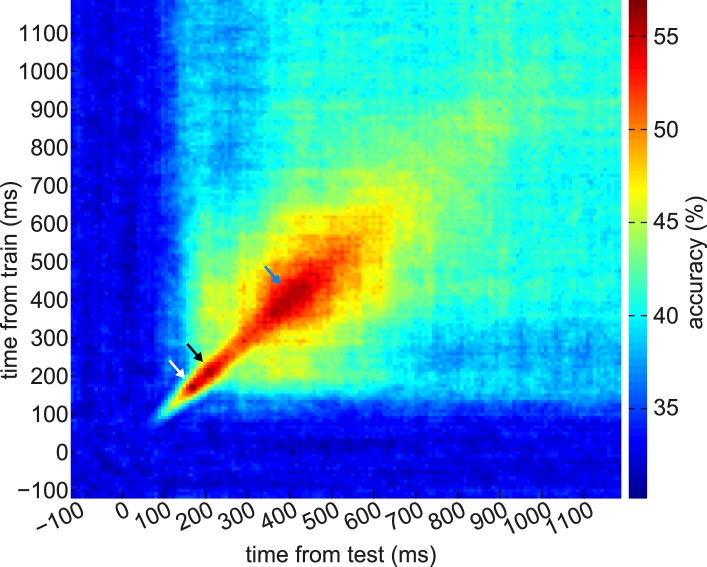
Figure 3. Multivariate analysis reveals two temporal components of evoked response to visual stimuli.
(A) Multivariate decoding performed well to predict the category of photograph (Si) in the Association phase. Cross-validated linear SVM prediction accuracy using all 275 sensors at each time bin is shown. A pattern of two distinct peaks in classifier accuracy around 200 ms and 400 ms after Si onset is evident. (B) At 200 ms after Si onset, there was no difference in representational similarity between same-category and different-category Si objects (left panel, p = 0.2 by t-test between subjects). At 400 ms, representational similarity was higher for same-category than different-category objects (right panel, p = 5 × 10⁻⁷). F1–F4, B1–B4 and S1–S4 refer to the unique faces, bodies and scenes presented during the Association phase. (C) When discriminating fractal identity (i.e., a 6-way classification problem of stimuli with no natural categories), performance was sharply peaked before 200 ms after fractal onset. Shaded area shows standard error of the mean.


