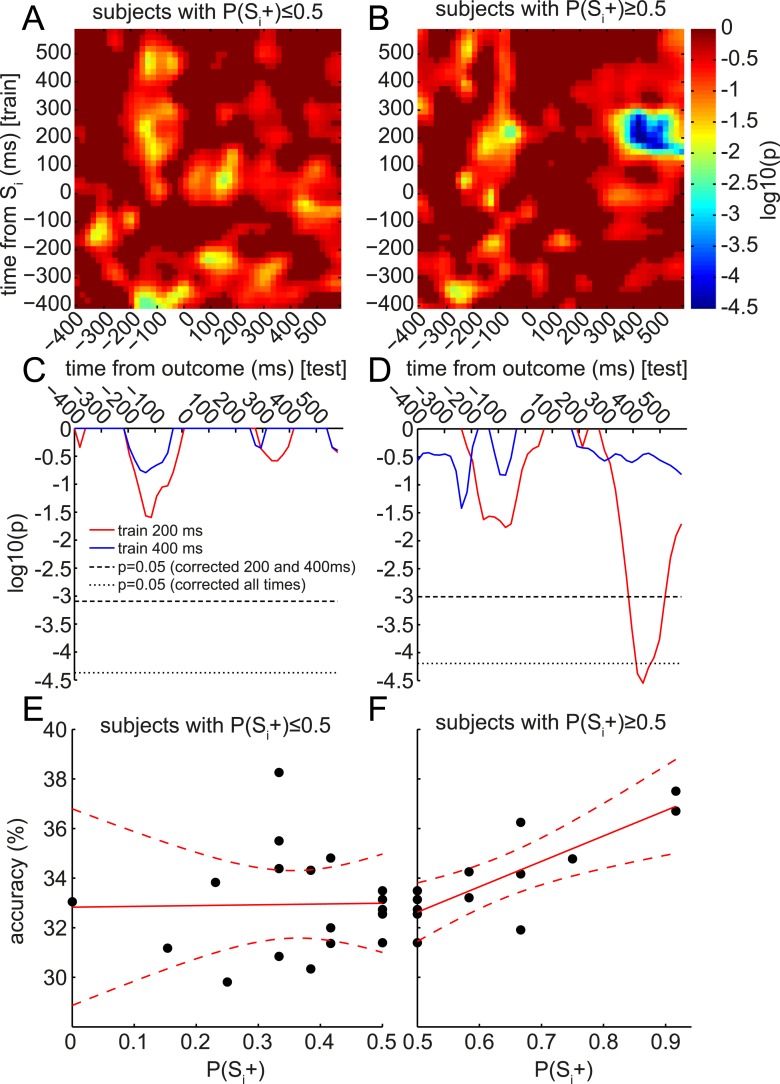
Figure 6. Retrieval of early component of Si representation predicts value updating across subjects.
At the group level, only the 400 ms component was significantly retrieved at the time of outcome (cf. Figure 4B). However, at the single-subject level, the degree of retrieval of the 200 ms component correlated with value updating. As in Figure 4B, the accuracy of classifiers trained at each time bin around Si (in the Association phase) was tested at each time bin around the time of outcome (in the Reward phase) to predict the category of the Si associated with the Sd preceding the outcome. In each time*time bin, this accuracy was regressed, across subjects, against the behavioral preference for Si+ over Si− from the Decision phase (i.e., P(Si+)). As we only explored positive correlations, one-tailed log10 p-values of the regression are reported. (A) In subjects who preferred Si− over Si+, there were no correlations between the degree of preference and the degree of reinstatement of Si at outcome. (B) In subjects who preferred Si+ over Si−, there was a strong correlation between the degree of preference and the degree of reinstatement. This correlation peaked at around 400 ms after outcome onset. (C, D) Red and blue traces show single rows of panels A and B at 200 and 400 ms. Significance was tested by randomly shuffling subject identities to obtain a null distribution of peak-level log10 p-values. Thresholds are shown at 95% of the null distribution of the peak-level of 200 and 400 ms rows, and at 95% of the null distribution of peak-level of all rows. (E, F) Raw classification accuracies underlying the correlations in A–D, when training at 200 ms after Si onset and testing at 400 ms after outcome onset. Each point is a subject.

