2.

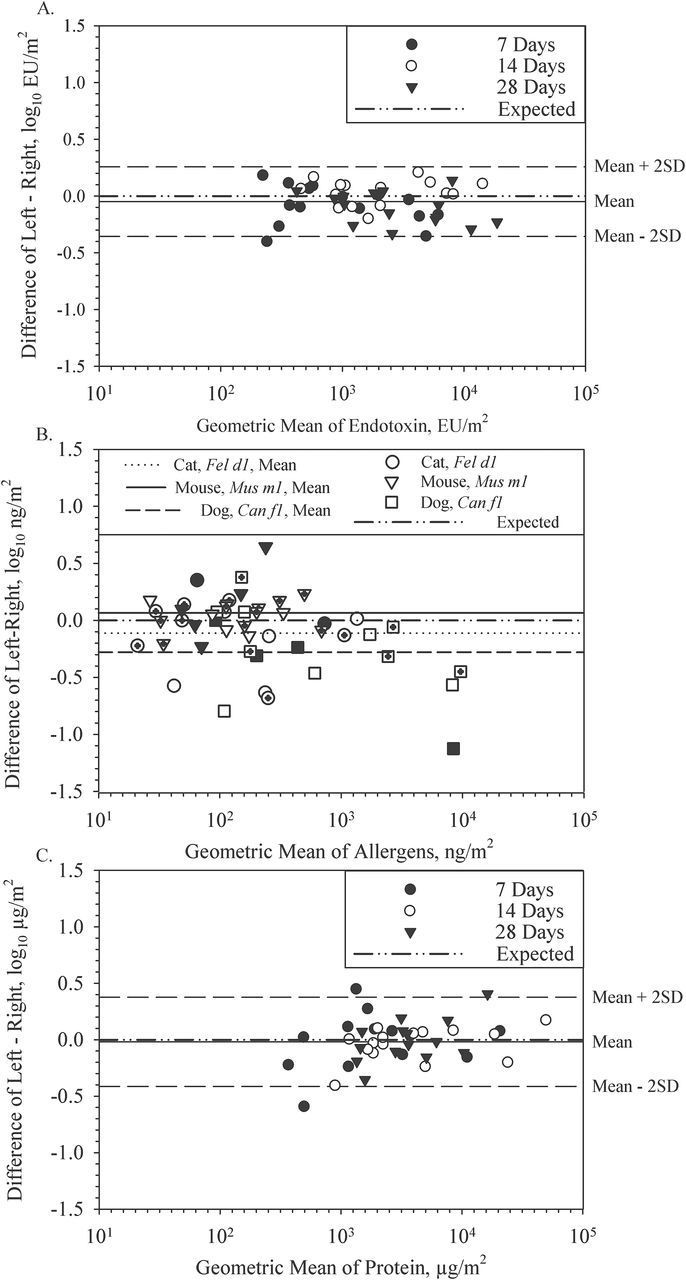
Bland–Altman plots showing within-electrostatic dust collector (EDC) left and right cloth comparisons of endotoxin (A), allergens (B), and protein loads (C) in each farm home for EDCs deployed for 7, 14, and 28 days of sampling. Allergen data for 7-day deployment are shown with a filled symbol, 14-day with an open symbol and 28-day with a hatched symbol.
