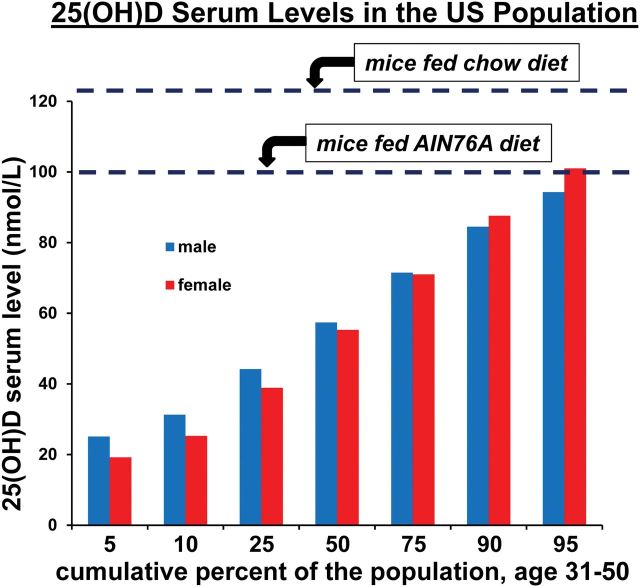
Fig. 5.
Serum 25(OH)D levels in the US population and in mice exposed to different diets. The cumulative percent of the US population of males or females, age 31–50, showing different levels of serum 25(OH)D was plotted from the NHANES data established by the Center for Disease Control and Prevention (http://www.cdc.gov/nchs/nhanes/nhanes_products.htm). Dashed lines indicate the mouse serum levels of 25(OH)D established by feeding control AIN76A diet or a standard chow diet (5058 from LabDiets), as previously reported.

