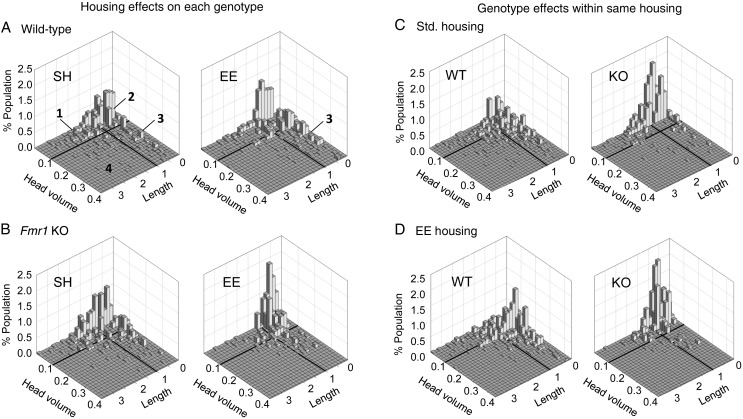
Figure 7.
Subtraction analysis shows effects of housing and genotype on the physical proportions of dendritic spines. Histograms showing the differences in unique spine populations between housing conditions for each genotype (A and B) and for each genotype under the different housing conditions (C and D). For each pair-comparison, the overlapping distributions were subtracted away leaving only the spine population that is unique to each condition plotted. The 4 size zones, identified in A (left) are defined by boundaries at 1 μm3 head volume and 1 μm spine length (bold lines). (A) The distributions of nonoverlapping spines for WT SH and WT EE groups were similar although the EE group had fewer long-thin spines (zone 1) and spines with larger head volumes (zone 3; see Table 1 for values). (B) For the KOs, housing in the EE reduced the scatter in spine head volume and length, relative to profiles from SH mice thereby increasing the proportion of nonoverlapping spines that were both short and narrow (zone 2). (C) Population distributions show clear effects of genotype in both housing conditions. With SH, nonoverlapping spines for the WTs are clustered in zones 2 and 3 whereas for the KOs they are clustered in zones 1 and 2 and have particularly small head volume. (D) The nonoverlapping spines for WT and KO mice in the EE are similar to that seen after SH (compare to panel C) although for the WTs fewer spines have very small heads (≤0.05 μm3) and for the KOs unique spines are less numerous in zone 1. See Table 1 for further zone analyses.

