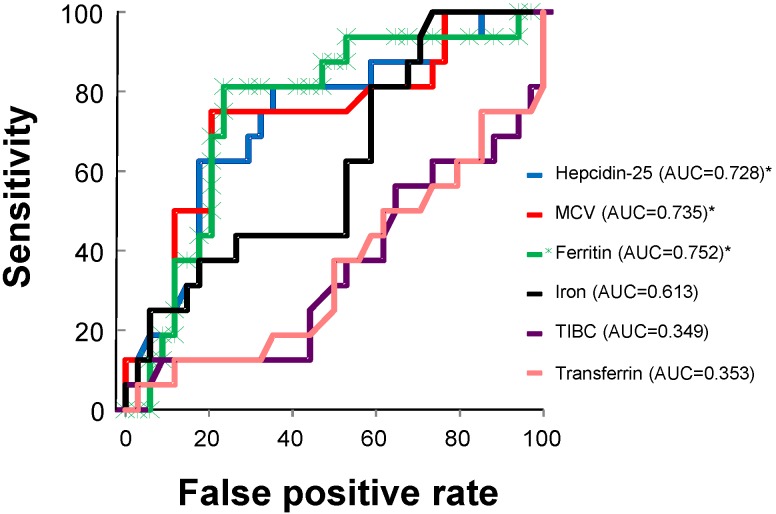
Figure 3.
A ROC curve analysis for the evaluation of variables predictive of the response to OIT. A ROC curve analysis revealed that serum hepcidin-25 (95% CI = 0.576–0.880, p = 0.001), MCV (95% CI = 0.580–0.891, p = 0.008), and serum ferritin (95% CI = 0.605–0.899, p = 0.004), but not serum iron (95% CI = 0.448–0.778, p = 0.201), TIBC (95% CI = 0.178–0.520, p = 0.088), or serum transferrin (95% CI = 0.183–0.523, p = 0.096), emerged as significant predictors of the response to OIT. * Statistically significant. AUC, area under the curve; MCV, mean corpuscular volume; TIBC, total iron binding capacity.

