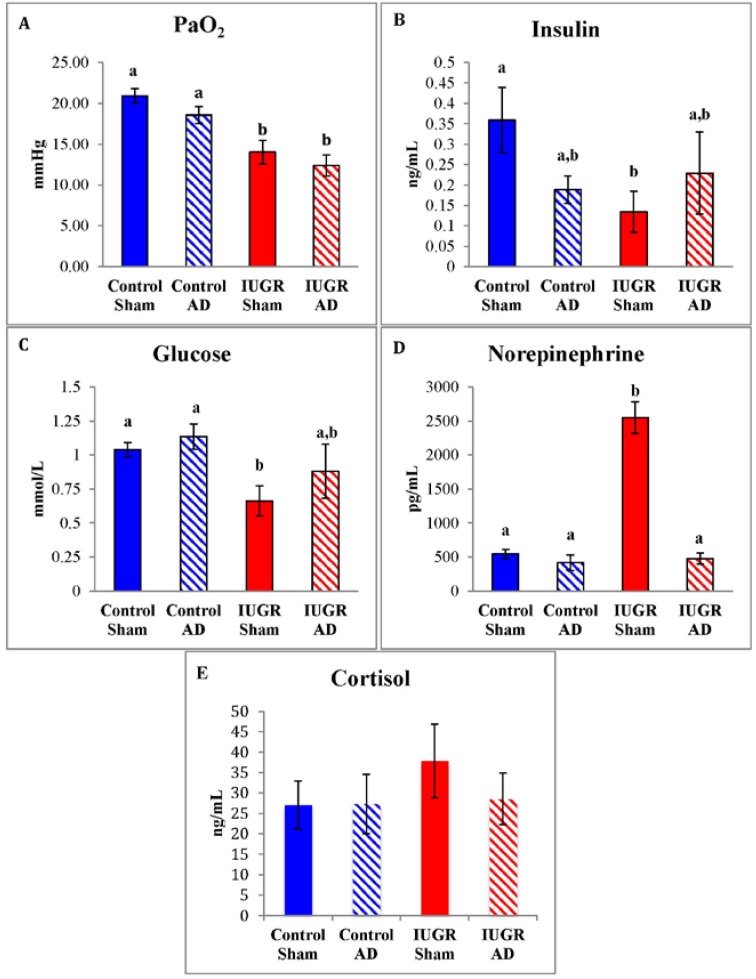
Figure 1.
Fetal arterial oxygen tension and plasma glucose and hormone concentrations. Means (±SEM) for arterial blood oxygen tension (PaO2; A); insulin (B); glucose (C); norepinephrine (D); and cortisol (E) are graphed for control-sham, control-adrenal demedullation (AD), intrauterine growth restriction (IUGR)-sham, and IUGR-AD treatment groups (x-axis). Error bars represent the SEM and different superscripts denote statistically significant differences among treatment groups (p < 0.05).

