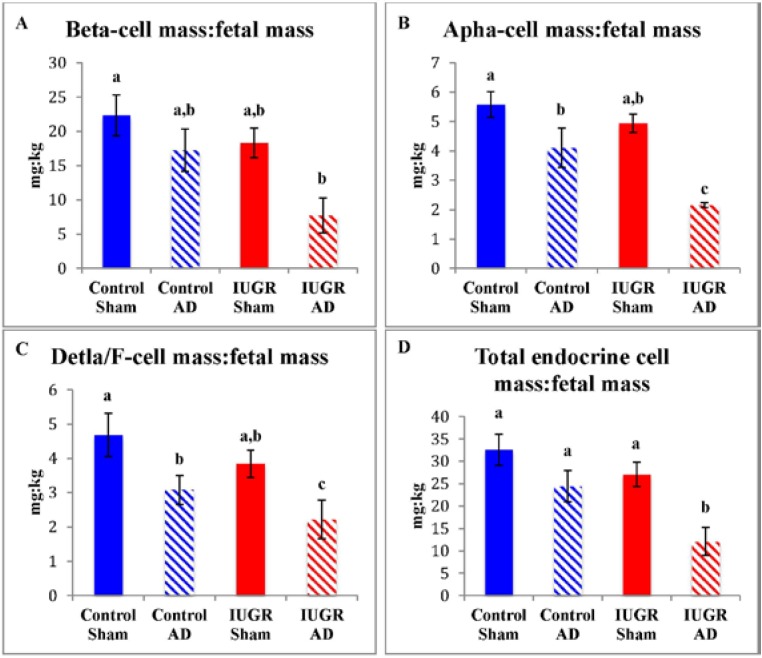
Figure 5.
Endocrine cell mass relative to fetal mass. Means are graphed for β-cell (A); α-cell (B) combined δ-cell and F-cell (C); and total endocrine cell (D) mass expressed as a proportion of fetal mass (mg/kg). The treatment groups are presented on the x-axis. Error bars represent the SEM and different superscripts denote statistically significant differences among treatment groups (p < 0.05).

