Figure 6.
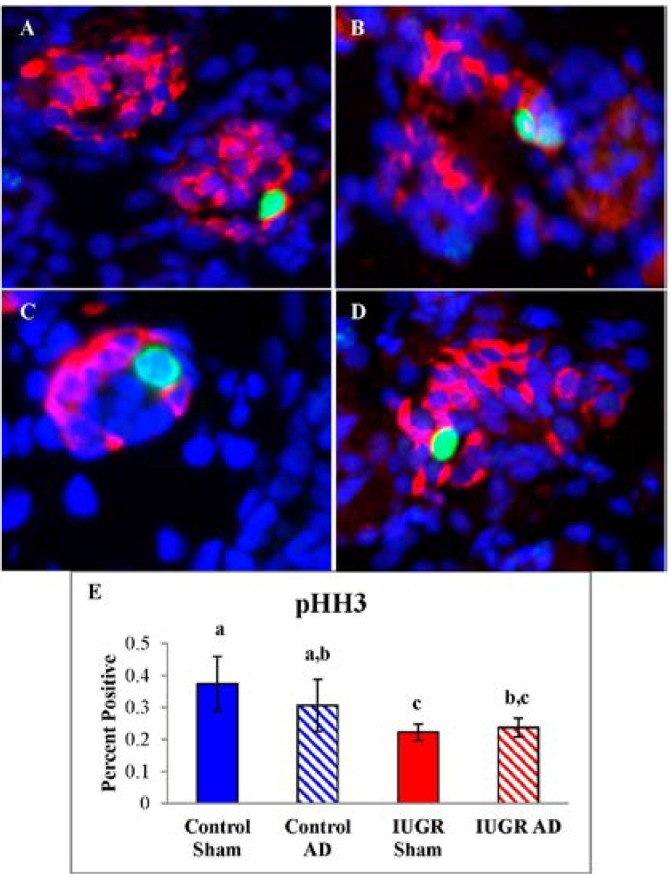
β-cell Proliferation Rates. Pancreas tissues were immunostained for phosphorylated-Histone H3 (pHH3; green), insulin (β-cells; red), and nuclear DNA (DAPI; blue). Representative micrographs are presented for control-sham (A); control-AD (B); IUGR-sham (C); and IUGR-AD (D). The mean (±SEM) percentages of pHH3 positive β-cells are graphed for treatment groups labeled on the x-axis (E). Error bars represent the SEM and different superscripts denote statistically significant differences among treatment groups (p < 0.05).

