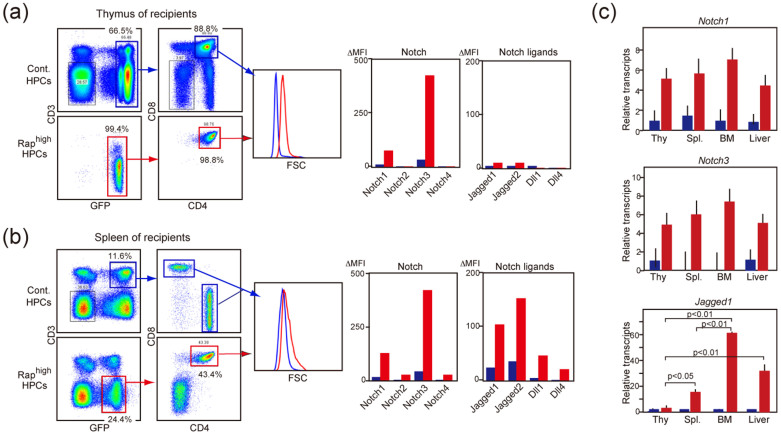
Figure 6. Expression of Notch ligands in primary T-ALL cells invading extrathymic organs.
(a, b) Sipa1−/− BM HPCs infected with empty (blue lines and columns) or C3G-F-containing retrovirus (red lines and columns) were transplanted into 8.5 Gy γ-ray-irradiated mice. After 15 weeks, the cells from the thymus (a) and the spleen (b) were multicolor-analyzed with the indicated antibodies. The cell sizes (FSC) and expression of Notch and ligands (ΔMFIs) in GFP+ T cells are shown. Essentially similar results were obtained in 3 independent recipients. (c) GFP+ T cells were sorted from the indicated organs of Raphigh HPC (red columns) and control HPC (blue columns) recipients, and the transcripts of indicated genes were determined with qRT-PCR. The means and SEs of 3 recipients are shown.

