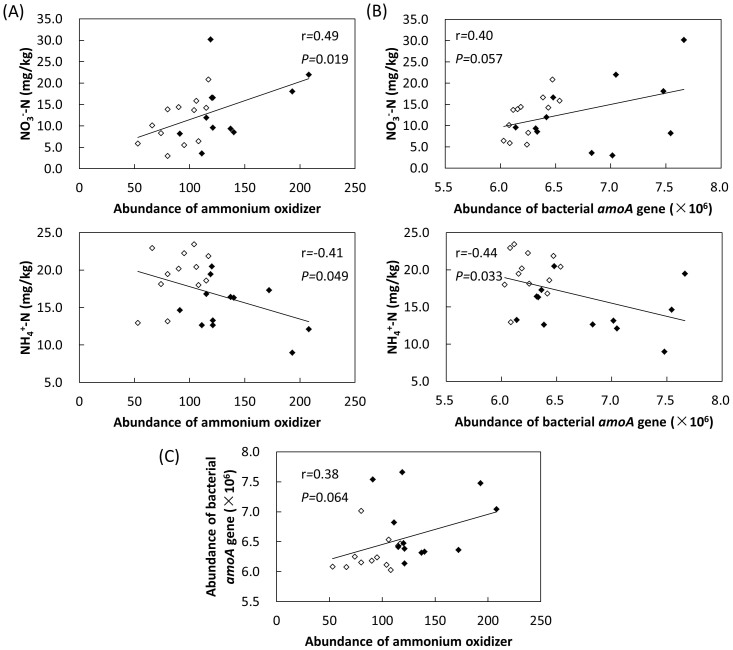
Figure 5. Correlations between (A) NH4+-N, NO3−-N and total abundance of ammonium oxidizer, (B) NH4+-N, NO3−-N and total abundance of bacterial amoA gene, and (C) abundance of ammonium oxidizer and bacterial amoA gene.
White and black dots represent samples from the shrubland and the coniferous forest, respectively.

