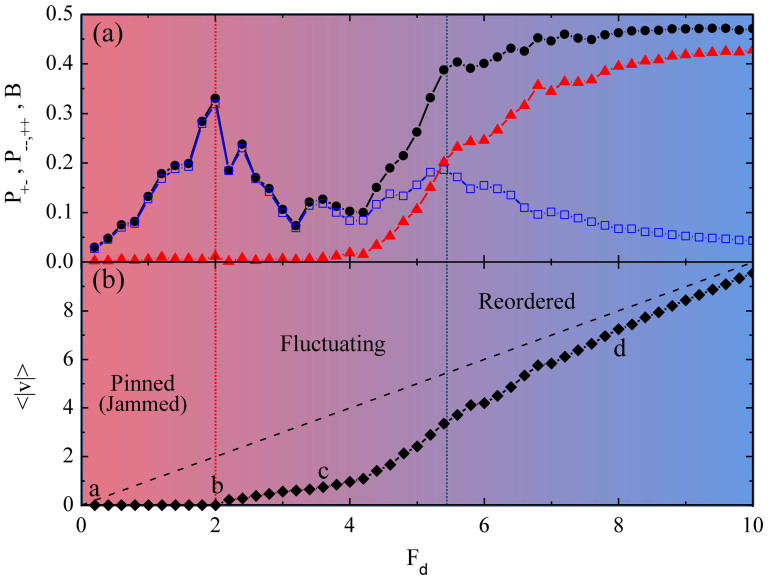
Figure 2.
(a) P+− (blue squares), the fraction of dipolar walls, vs Fd has a peak just below yielding. P−−,++ (black circles), the fraction of uni-polar walls, passes through a plateau when the polarized wall state forms. B (red triangles) is a measure of the net Burgers vector in the walls. (b) The average absolute value of the dislocation velocity 〈|v|〉 (solid lower curve) vs Fd. The upper dashed curve shows 〈|v|〉 for non-interacting dislocations. Points a, b, c, and d indicate the Fd values illustrated in Fig. 1.

