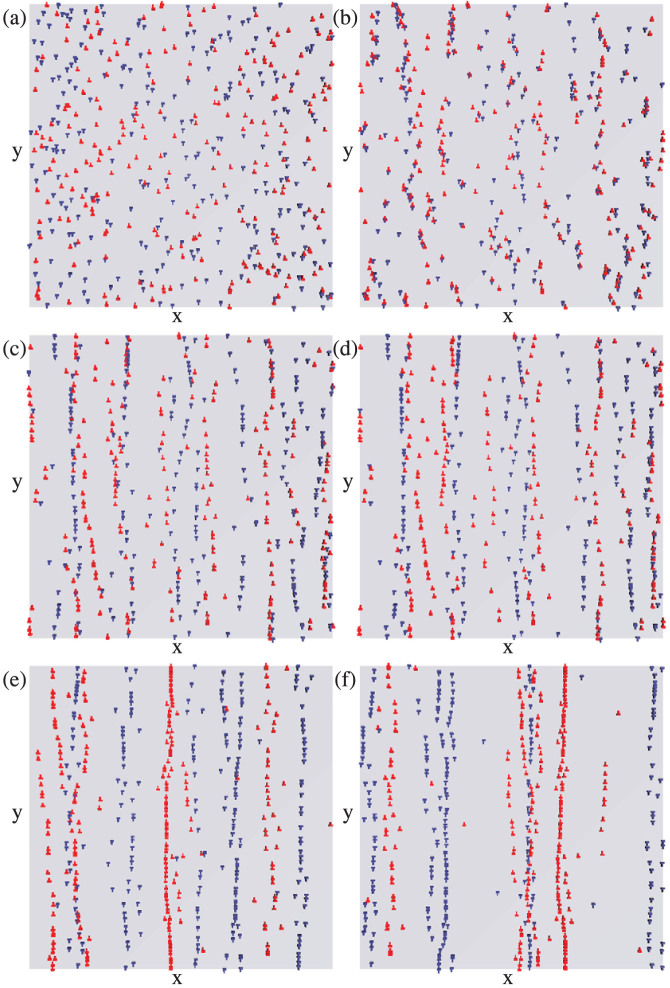
Figure 6.
The red (blue) crosses are the locations of the dislocations with positive (negative) Burgers vectors in a sample with N = 480 that has been instantaneously loaded with Fd = 10. The time progression of the formation of multiple unipolar walls is illustrated. (a) Initial dislocation configuration. (b) After 1 time unit. (c) After 3 time units. (d) After 5 time units. (e) After 20 time units. (f) After 149 time units.

