
Figure 3. Immunohistochemical stainings and CD31, Ki-67 and LAMP-1 and -2 quantification.
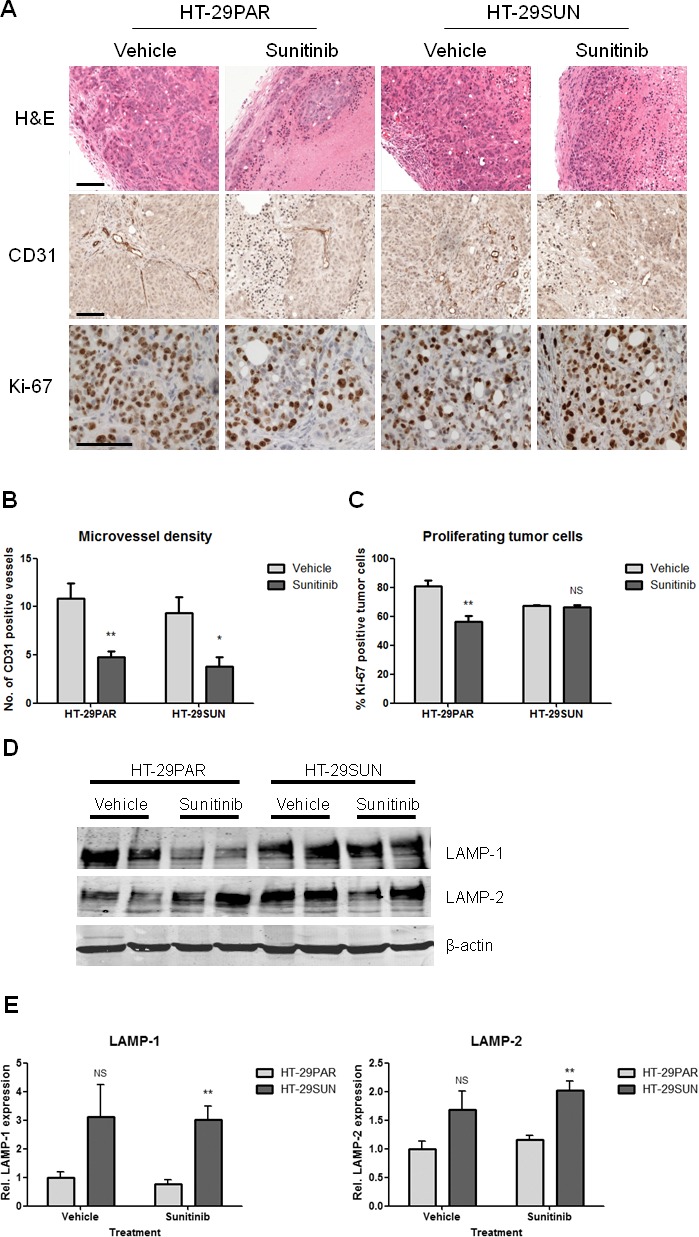
(A) Representative pictures of (immunohistochemical) stainings of tumors established from HT-29 parental (HT-29PAR) and HT-29 sunitinib resistant (HT-29SUN) tumor cells, treated with vehicle or sunitinib. Upper panel: H&E staining; middle panel: CD31 staining; lower panel: Ki-67 staining. (B) Quantification of microvessel density (MVD) using CD31 staining (n = 8). Data are expressed as number of CD31 positive vessels per 200x field. (C) Quantification of tumor cell proliferation using Ki-67 staining (n = 4). Data are expressed as Ki-67 positive tumor cells as percentage of total tumor cells. (D) Western blot of lysosomal associated membrane proteins-1 and -2 (LAMP-1 and -2). Two representative tumor tissue samples per group are shown. (E) Quantification of LAMP-1 and -2 by western blot analysis (n = 4). LAMP-1 and -2 expression was corrected for β-actin expression, and normalized to vehicle-treated tumor samples. Results are shown as mean ± SEM; *, P < 0.05; **, P < 0.01, NS =not significant. Scale bars are 100 μm.