
Figure 4. Co-treatment of sunitinib with chloroquine.
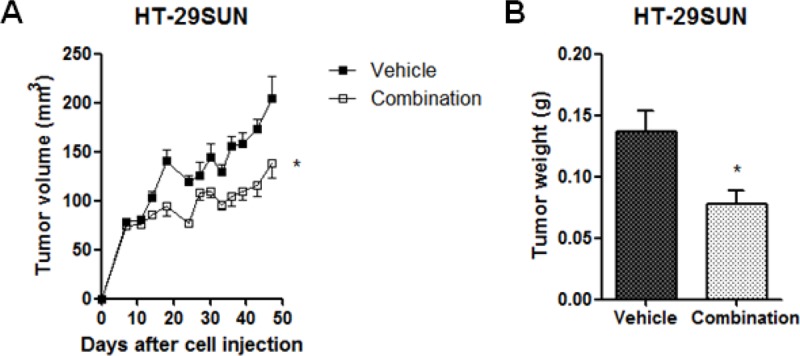
(A) Growth curves and (B) Tumor weights at the end of the experiment of tumors established from HT-29 sunitinib resistant (HT-29SUN) tumor cells after tumor cell injection. Mice were treated with vehicle or the combination of sunitinib malate (40 mg/kg/day) and chloroquine diphosphate (50 mg/kg/day). Results are shown as mean ± SEM (n = 4-6); *, P < 0.05.